
PEPE Preparing For A 54% Move? Analyst Thinks So
An analyst has explained how a PEPE daily close outside of a certain price range could lead its value to go on a rally of 54%.
PEPE Symmetrical Triangle May Hint At The Next Move For The Memecoin
In a new post on X, analyst Ali discussed the recent trend forming in the PEPE price. According to the analyst, the memecoin is currently forming a symmetrical triangle pattern on its one-day chart.
The “symmetrical triangle” here refers to a pattern in technical analysis (TA) that, as its name suggests, looks like a triangle. In this pattern, there are two lines of interest between which the asset’s price consolidates for a period.
The upper line connects successive tops, while the lower one joins together bottoms. The main feature of the pattern is that these two lines approach each other at a roughly equal and opposite slope (hence the “symmetrical” in the name).
There are other triangle patterns in TA, but those have either differently angled lines (as is the case with wedges) or one line parallel to the time-axis (ascending and descending triangles).
Like other TA patterns that represent a consolidation phase, the lines of the symmetrical triangle also serve as a point of potential reversal for the price. The upper line usually offers resistance (meaning tops can occur), while the lower line may provide support (bottom formation).
When a break takes place from either of these lines, the price may likely see sustained momentum in that direction. This implies that a break above the triangle could be a bullish signal, while one below may be bearish.
The symmetrical triangle may be viewed as a phase of the market in which the bulls and bears are at a standstill, hence why the price is ranging sideways. During a break, one of these wins out, and price action follows in that direction.
Naturally, as the lines converge towards a center point in this pattern, a breakout becomes increasingly probable the closer to the apex of the triangle the asset’s price gets.
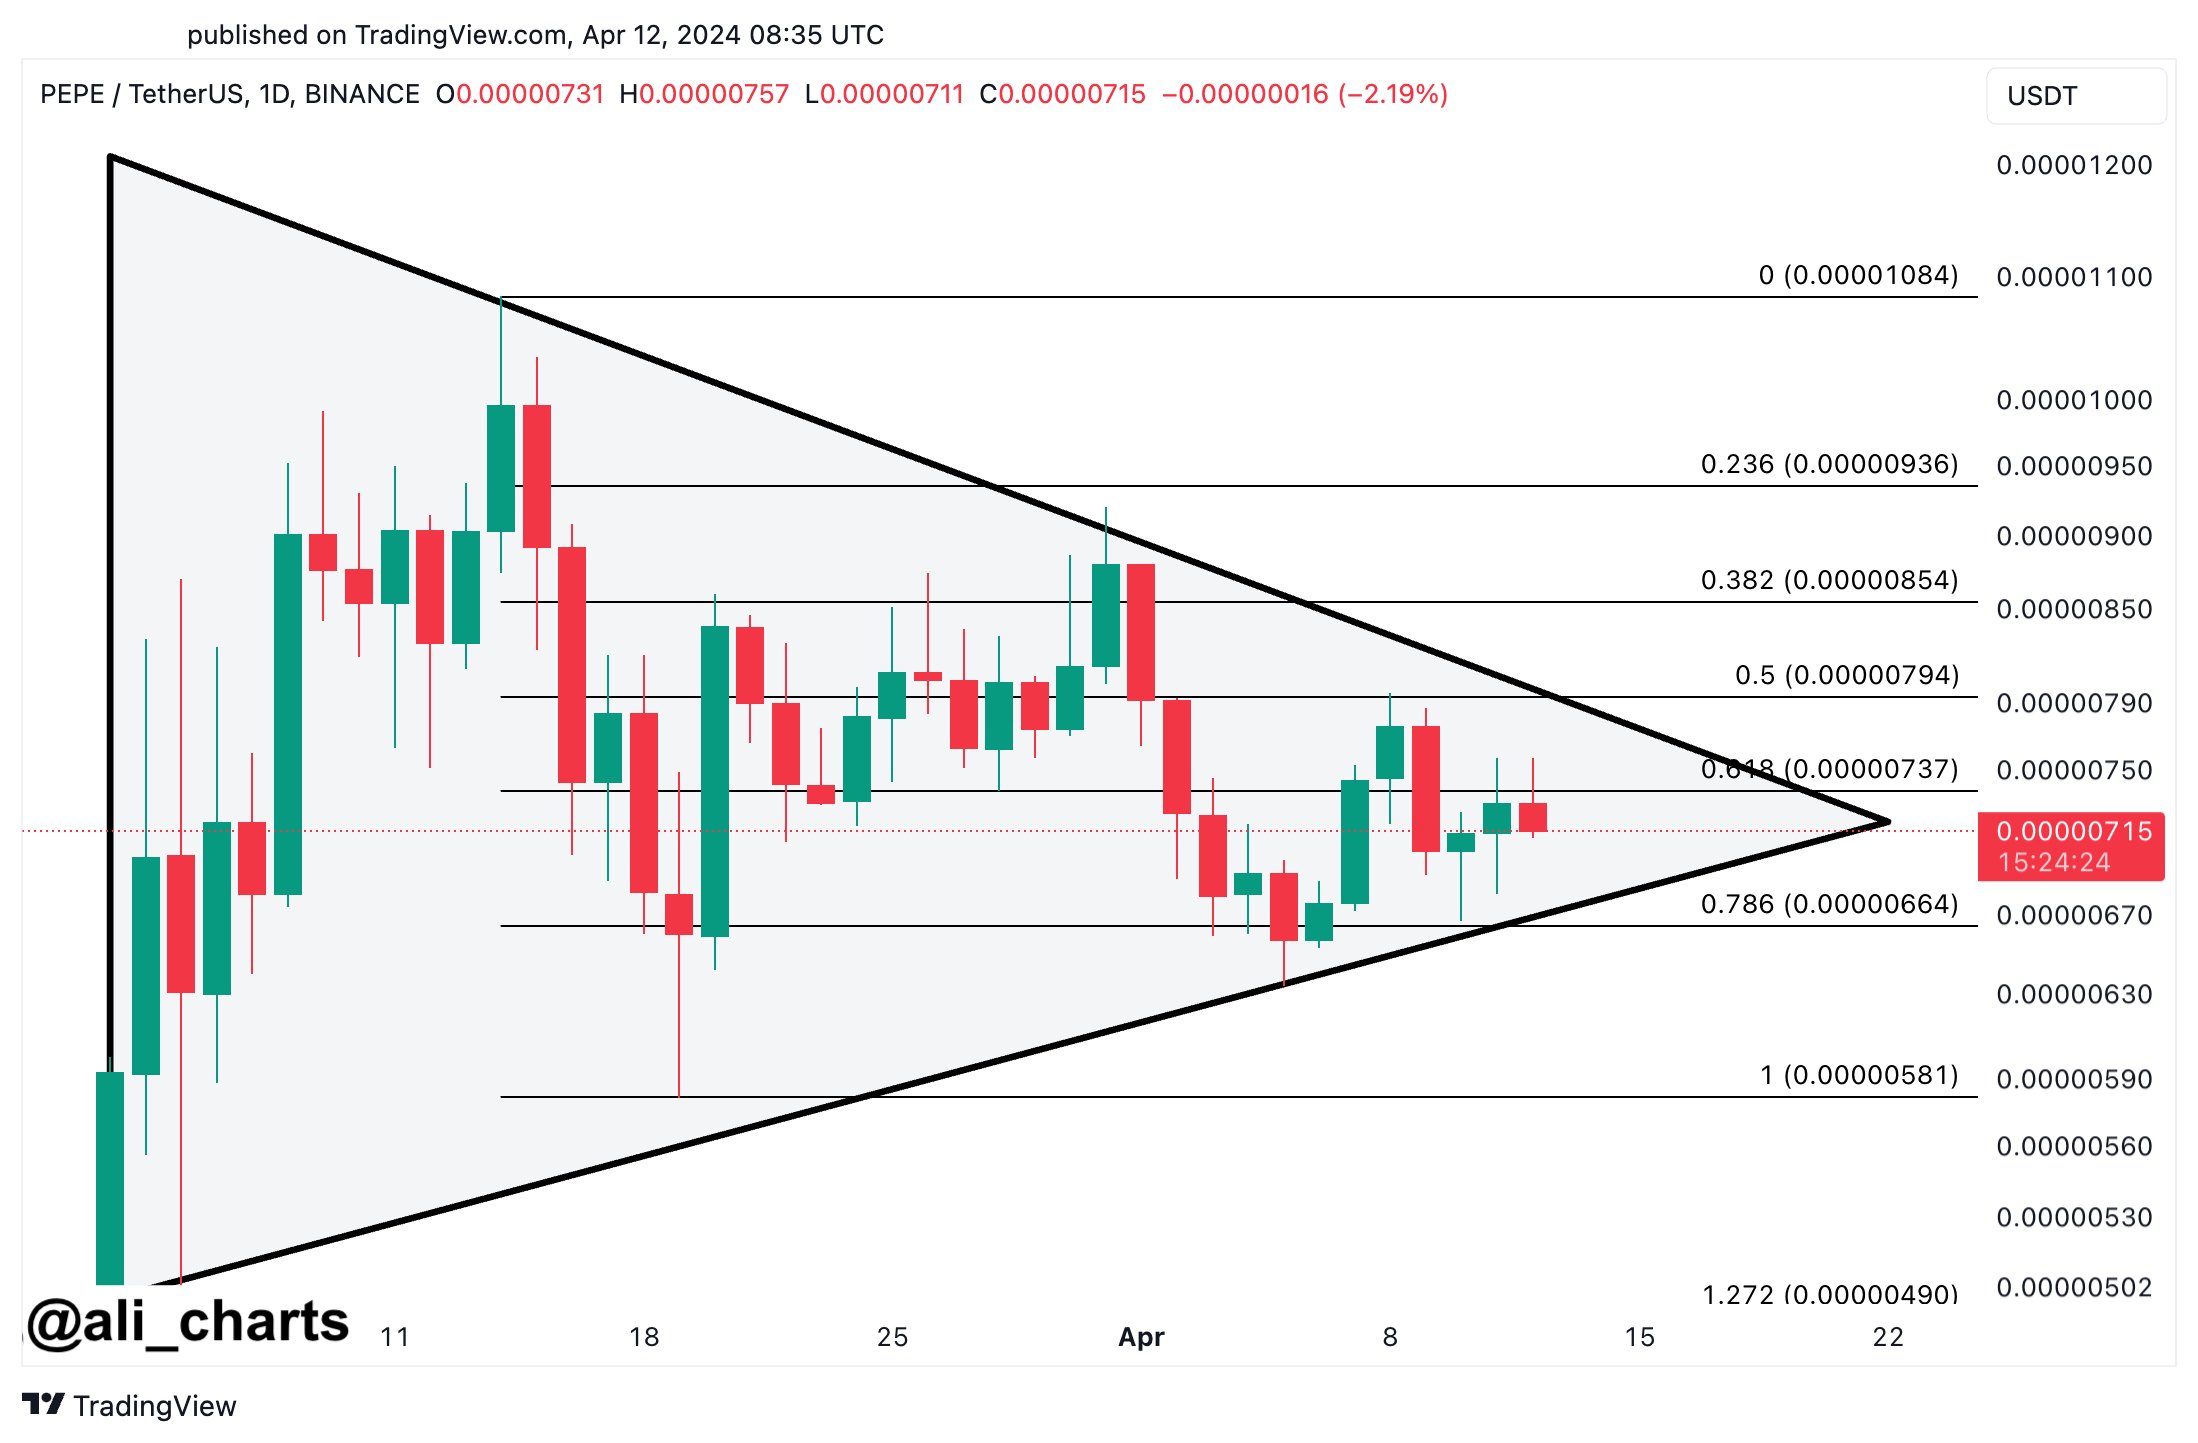
Now, here is the chart shared by Ali that highlights the symmetrical triangle pattern that PEPE has been trading inside recently:
Looks like the asset's price is getting closer to the converging point of the pattern | Source: @ali_charts on X
As is visible in the graph, the 1-day price of PEPE has been approaching the triangle’s apex recently, implying that a break in a direction may be coming for the memecoin.
“Watch out for a daily close outside of the $0.00000793 – $0.00000664 range, which could lead to a 54% move for PEPE,” explains the analyst. Given the pattern that has been forming, it now remains to be seen how the asset’s price will play out from here.
PEPE Price
At the time of writing, PEPE is trading around $0.000006868072, up 3% over the past week.
The price of the memecoin appears to have gone down recently | Source: PEPEUSD on TradingView
Featured image from Shutterstock.com, charts from TradingView.com
Disclaimer: The article is provided for educational purposes only. It does not represent the opinions of NewsBTC on whether to buy, sell or hold any investments and naturally investing carries risks. You are advised to conduct your own research before making any investment decisions. Use information provided on this website entirely at your own risk.


