

Ethereum price retests $2,550 as RSI nears 67
Ethereum price rebounded nearly 6% from its 24-hour low to trade near $2,524 on Sept. 4, but the recovery has brought ETH back to a resistance zone that has rejected several breakout attempts.
Summary
- Ethereum price recovered from about $2,370 to above $2,520 within 24 hours.
- The 4-hour RSI rose to 66.87 as ETH approached the upper Bollinger Band.
- Liquidation clusters sit near $2,540–$2,550 and between $2,485 and $2,490.
- A weekly close above $2,550 could open a path toward $3,000, according to analyst Ted Pillows.
Ethereum price rebounds toward $2,550
According to data from crypto.news, Ethereum (ETH) price was trading around $2,524 at the time of writing, up approximately 5.7% over the previous 24 hours. The rebound followed a fall to roughly $2,370, leaving ETH about 6.5% above its intraday low.
The recovery coincided with a broader crypto rally that lifted Bitcoin above $81,000. US markets also moved higher after Federal Reserve Governor Christopher Waller said he could support keeping interest rates unchanged if inflation continued to ease.
Waller’s comments reduced expectations for a rate increase at the Fed’s Sept. 15–16 meeting. Treasury yields and the US dollar declined as traders adjusted their interest-rate positions.
Weak US employment data added to the shift. The ADP National Employment Report showed private employers created 38,000 jobs in August, below economists’ estimate of about 47,000. The reading gave rate-sensitive assets further room to recover before the official US employment report.
Despite the rebound, ETH has not confirmed a breakout. The price reached an intraday high of approximately $2,547 before returning below $2,550, leaving the same resistance that stopped earlier advances intact.
Whale transfers add supply risk
Blockchain tracker Lookonchain reported that one large holder received 167,855 ETH, then began transferring the tokens toward centralized exchanges.
The wallet deposited 70,739 ETH, worth approximately $174 million at the time, into several exchanges over two days. It still held 97,115 ETH, valued at nearly $237 million, when the activity was reported.
Exchange deposits can precede sales, but transfers alone do not prove that every token was sold. The remaining balance also means that reports that the holder fully liquidated the entire 167,855 ETH position are not supported by the available on-chain data.
The transfers nevertheless created a potential source of market supply as ETH struggled around $2,550. Continued deposits could pressure the recovery, particularly if the price loses its short-term support levels.
US spot Ethereum exchange-traded funds have provided another source of demand. The products recorded $141.39 million in net inflows on Sep. 3, according to data attributed to SoSoValue.
Technical indicators favor buyers below resistance
The 4-hour ETH/USDT chart shows the price trading at $2,523.79, close to the Bollinger Band’s upper boundary at $2,544.17. The middle band, which tracks the 20-period simple moving average, stands at $2,444.67.
Ethereum’s 4-hour relative strength index has risen to 66.87, while its RSI moving average sits at 50.18. Momentum therefore favors buyers, but the indicator is approaching the 70 level commonly associated with overbought conditions.
A close above the upper Bollinger Band and $2,550 would strengthen the breakout case. The next visible resistance zones would sit near $2,600 and $2,700 before the psychological $3,000 mark.
Failure at $2,550 would keep $2,500 as the first level to watch. Below it, the Bollinger Band midpoint near $2,445 could serve as the next support, followed by the lower band at $2,345.
The daily chart offers a stronger medium-term signal. ETH remains above its Supertrend line at $2,223.45, while Chaikin Money Flow stands at 0.24. A positive CMF reading indicates that buying pressure has exceeded selling pressure over the indicator’s measurement period.
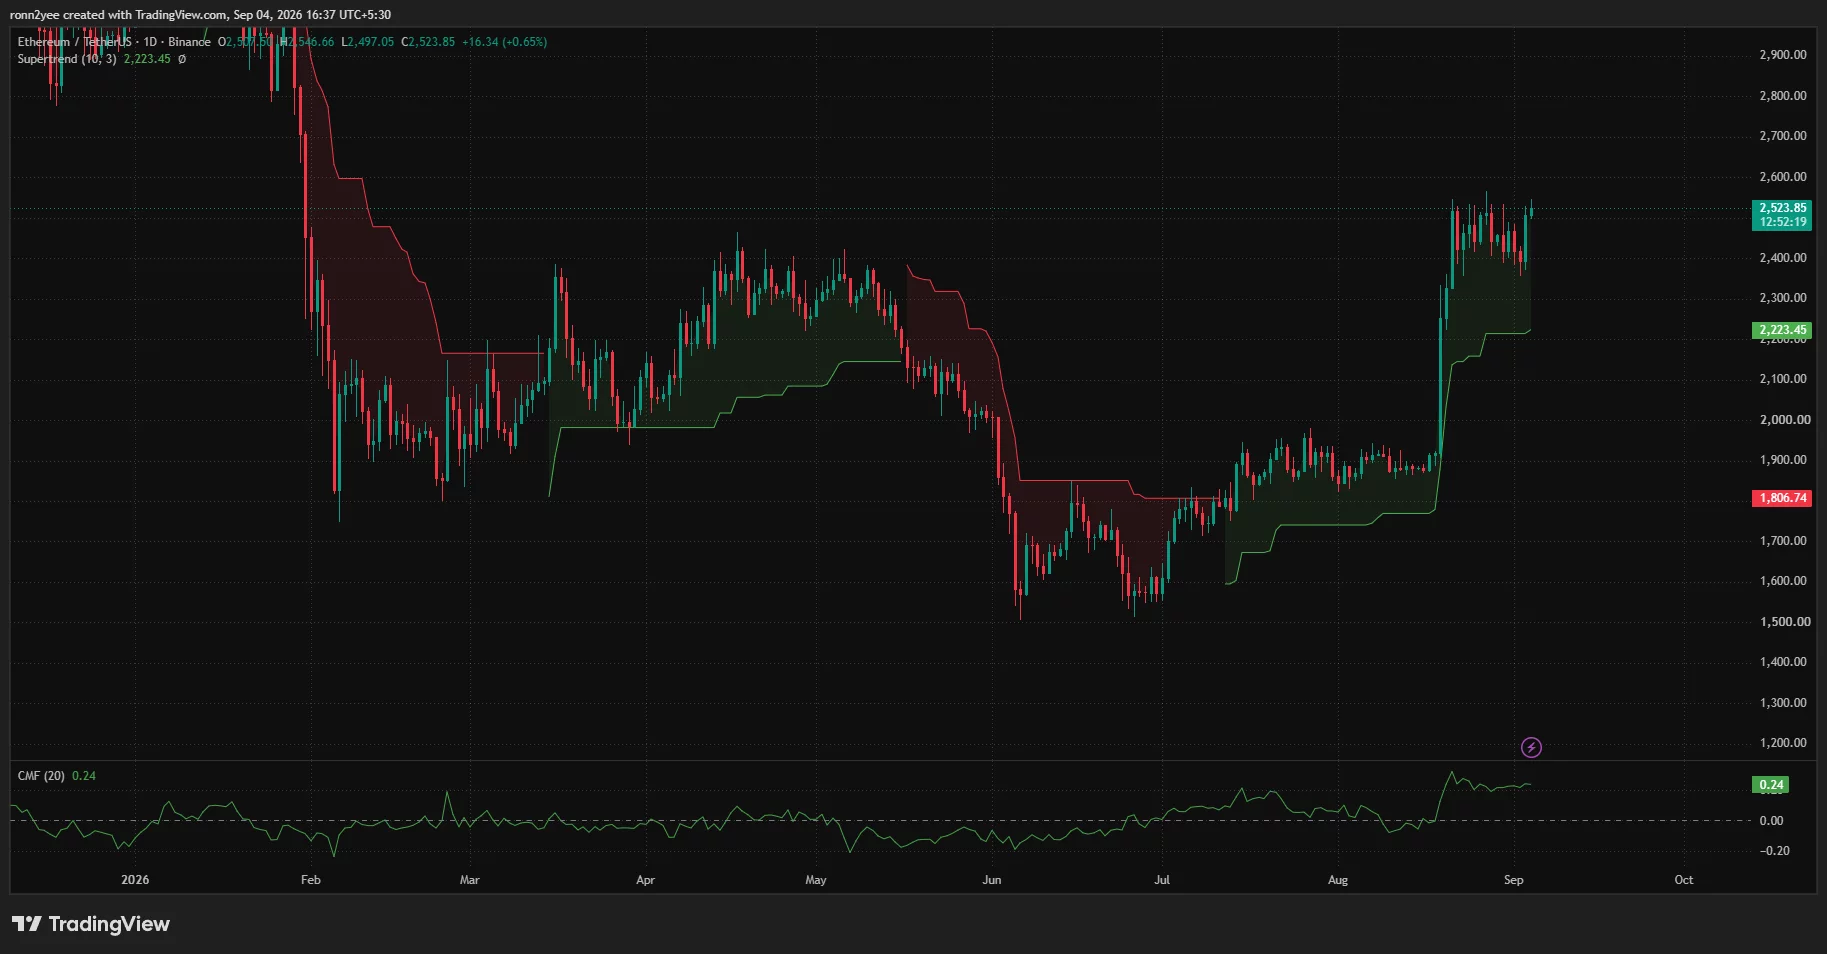
Losing $2,445 would weaken the short-term recovery without ending the broader daily uptrend. A move below $2,345 would place the recent low near $2,370 and the wider $2,300 support area at risk.
Liquidation map puts $2,550 in focus
The 24-hour CoinGlass liquidation heatmap shows one of the nearest overhead liquidity concentrations between approximately $2,535 and $2,550. A move through that band could force leveraged short positions to close, adding buying pressure to a confirmed breakout.
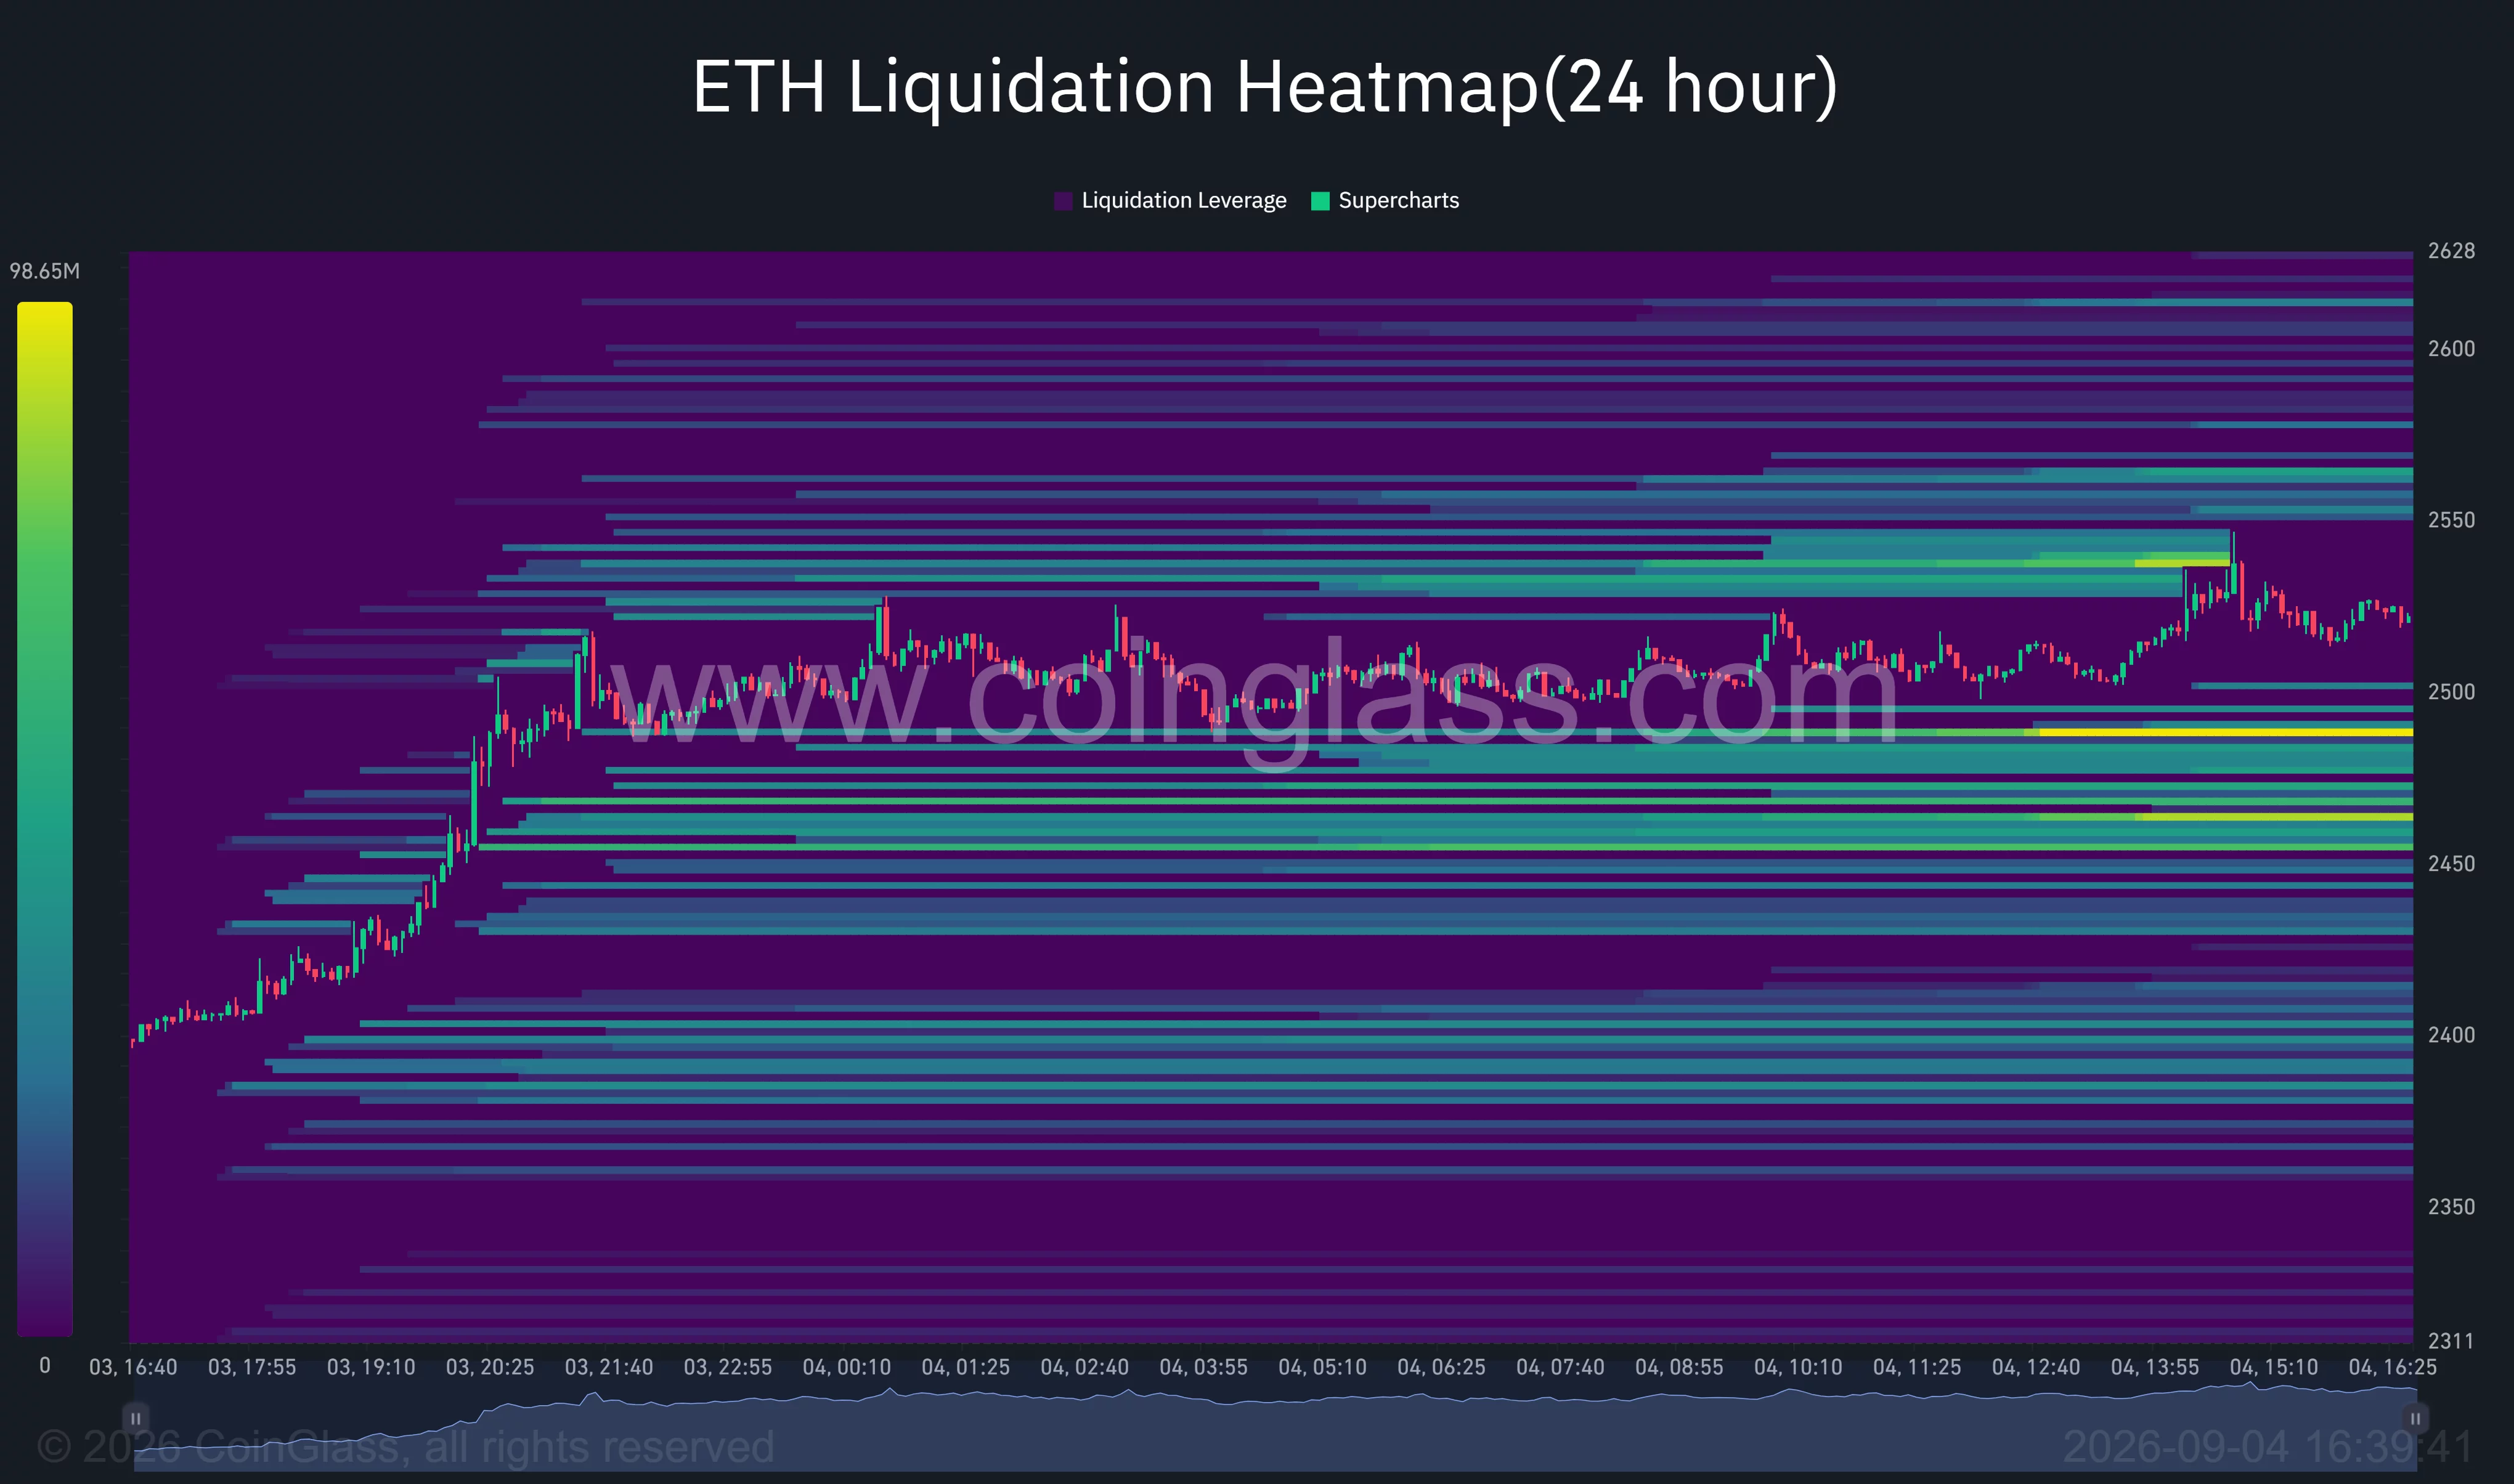
The strongest nearby downside concentration appears around $2,485–$2,490. Additional liquidation bands are visible near $2,460 and $2,400.
The map therefore places ETH between two close pools of leveraged exposure. A break above $2,550 could trigger a short squeeze, while a fall below $2,490 could accelerate a move toward $2,460.
CoinGlass reported approximately $115 million in ETH futures liquidations over the previous 24 hours. Open interest stood near $34.23 billion, showing that a large amount of leveraged positioning remained in the market after the recovery.
Analysts see $3,000 after a confirmed breakout
Analyst Ted Pillows said ETH had tested $2,550 and faced another rejection. He argued that a weekly close above the level could allow Ethereum to move quickly toward $3,000.
Market commentator Lucky also described $3,000 as a possible longer-term target, pointing to a breakout from a descending channel and a successful retest visible on his chart. His projection called for a potential 56% advance, although the forecast depends on ETH retaining its reclaimed trend structure.
Neither target is confirmed while Ethereum remains below $2,550. The immediate test is whether buyers can absorb selling around that level without allowing the price to fall beneath $2,490 and the 4-hour Bollinger midpoint.
For US traders, the official August jobs report and next week’s inflation readings could determine whether falling Treasury yields continue to support ETH. Stronger-than-expected data or renewed inflation pressure could restore rate-hike expectations and challenge the rebound.
Disclosure: This article does not represent investment advice. The content and materials featured on this page are for educational purposes only.


