XRP Trades Near Crucial Support Of $0.46, Will This Level Hold?
During the past week, the price of XRP has suffered significant losses due to a powerful selling wave. While the one-day chart reflects a 3% increase, the weekly chart shows a decline of over 12%. Buyers have faced resistance in the $0.45-$0.46 range and the technical outlook for XRP indicates a selling trend.
The demand for this altcoin has also dropped, leading to a decrease in accumulation. Unless buyers return to the market and stabilize the price, XRP is likely to continue losing value. Meanwhile, Bitcoin’s price has remained uncertain over the past week, and its recent climb above $28,000 may inspire other altcoins to follow suit.
For XRP to see upward momentum, Bitcoin must maintain a price above $27,000. Furthermore, XRP must surpass the immediate resistance level to preserve its current support level. The decline in XRP’s market capitalization suggests that sellers are currently in control of the market.
XRP Price Analysis: One-Day Chart
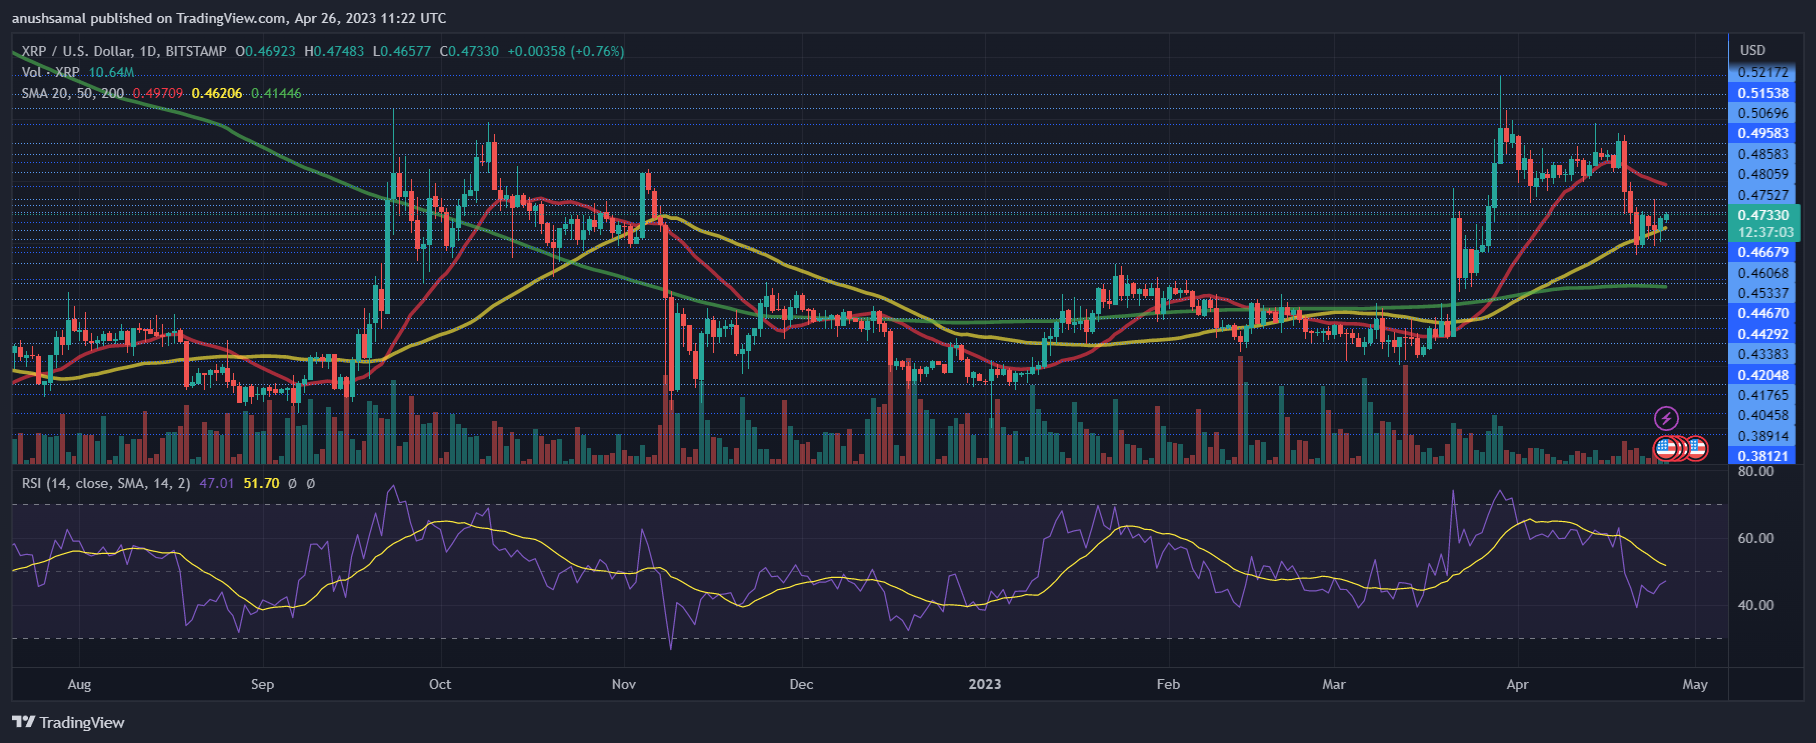
At the time of writing, the altcoin’s trading price is $0.47, and it currently stands above its critical support level of $0.46. Despite attempting to recover significantly over the past few weeks, XRP experienced considerable selling pressure in the past week.
The coin faces overhead resistance at $0.48, and breaching that level could drive the price up to $0.50. Conversely, if XRP fails to remain above $0.46, the coin may decline to around $0.42 and possibly $0.40. The amount of XRP traded in the last session was negative, indicating a decrease in demand.
Technical Analysis

Despite the daily chart indicating a recovery, buyers seemed hesitant to make a move. The Relative Strength Index (RSI) was below 50, implying that sellers currently outnumber buyers.
Although there was an uptick in the RSI, buying strength remained fragile unless XRP surpasses the immediate resistance level. Furthermore, the altcoin was below the 20-Simple Moving Average (SMA) line, indicating that sellers were driving the price momentum in the market.

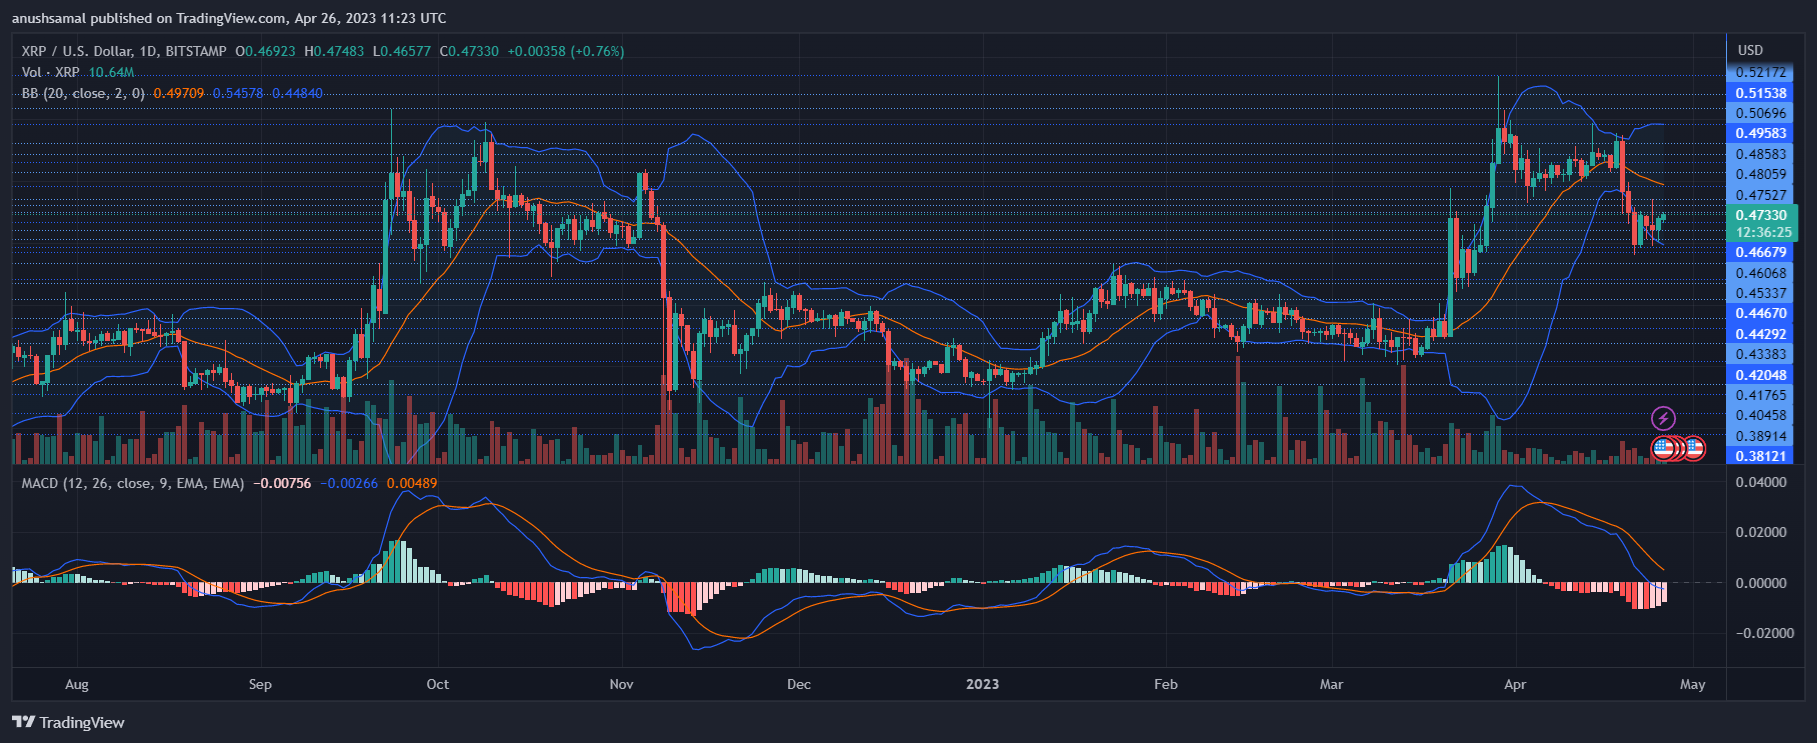
Aligned with other technical indicators, the altcoin began to exhibit sell signals on the one-day chart. The Moving Average Convergence Divergence (MACD) displays price momentum and trend reversals. Red histograms formed under the half-line, indicating a sell signal for the altcoin and a bearish price.
The Bollinger Bands measure price volatility and potential price fluctuations of the asset. The bands diverged in anticipation of incoming price volatility, with the upper band serving as a vital resistance level for the altcoin.
A move above the immediate price ceiling would aid XRP’s recovery and reduce the likelihood of heavy price fluctuation. Broader market strength will also be important for XRP to start its recovery.
Featured Image From UnSplash, Charts From TradingView.com


