XRP Price Could Hit $220 With Gamma-Ray Burst: Crypto Analyst
Egrag Crypto, a crypto analyst on X, has released a technical analysis that suggests a potential surge in the price of XRP to as high as $220, drawing a vivid parallel to the astronomical event known as a Gamma-Ray Burst (GRB). In financial charting, the GRB analogy reflects a surge in price with a significant magnitude and rapidity, akin to the intense energy release of a cosmic GRB.
Egrag utilizes a Fibonacci Channel (Fib Channel) for his forecast, a technical analysis tool that traders employ to identify potential levels of support and resistance based on the Fibonacci sequence. A Fib Channel is constructed by drawing a trendline between two extreme points, typically a high and a low, and then dividing the vertical distance by the key Fibonacci ratios. These levels are parallel lines that run across the chart, which can act as markers for price targets or reversals.
Cosmic XRP Price Targets
The 1-month chart of XRP/USD shared by Egrag on X outlines these Fib levels. Egrag notes, “Reflecting on XRP’s potential to mirror its 2017 trajectory, analyzing current price positions reveals crucial figures within The Fib Channel.” Accordingly, the significant future price points are at $2.2 (0.236 Fib), $5.8 (0.382 Fib), $11 (0.5 Fib), $33 (0.702 Fib), and finally, the zenith at $220 (1.0 Fib).
Furthermore, the analysis identifies the two “Bull Market Lines” on the chart, which have been instrumental in past XRP price movements. Egrag’s analysis anticipates a third encounter with these lines, a possible indicator of a new uptrend.
The first encounter was when the XRP price crossed the first “bull market line” in March 2017. The XRP price rose by a whopping 60,000%, from $0.005 to $3.30, the current all-time high. This now also forms the starting point for the second “bull market line”, with its second connection point derived from its April 2021 high at $1.97.
According to Egrag, the XRP price currently needs to overcome the $1.20 mark in order to cross the “Bull Market Line – 2”. An impulse for this could be a crossover of the Simple Moving Average (SMA) and 24 SMA in the 1-month chart.
Egrag notes, “Once the bullish cross happens, almost 1 month later, the XRP bull run starts,” aligning with historical price actions marked on the chart as ‘Cross 1’ and ‘Cross 2’. The analyst suggests that a similar crossover is imminent, forecasting a shift from a bearish to a bullish market. Notably, the crossover happened at the end of December 2023 and the beginning of January 2024.
Egrag’s commentary on the social platform X adds a rallying call to the XRP community: “XRP Army: STAY STEADY And Get Ready, the shift from Red to Blue, and eventually to Green, is imminent. It will be a GRB Event.”
The Momentum Still Has To Turn Bullish
In conclusion, Egrag’s analysis presents a bullish case for the altcoin, with precise price targets and technical indicators serving as a guide for potential future movements. However, as with all market analyses, investors are advised to approach with caution and conduct their own research.
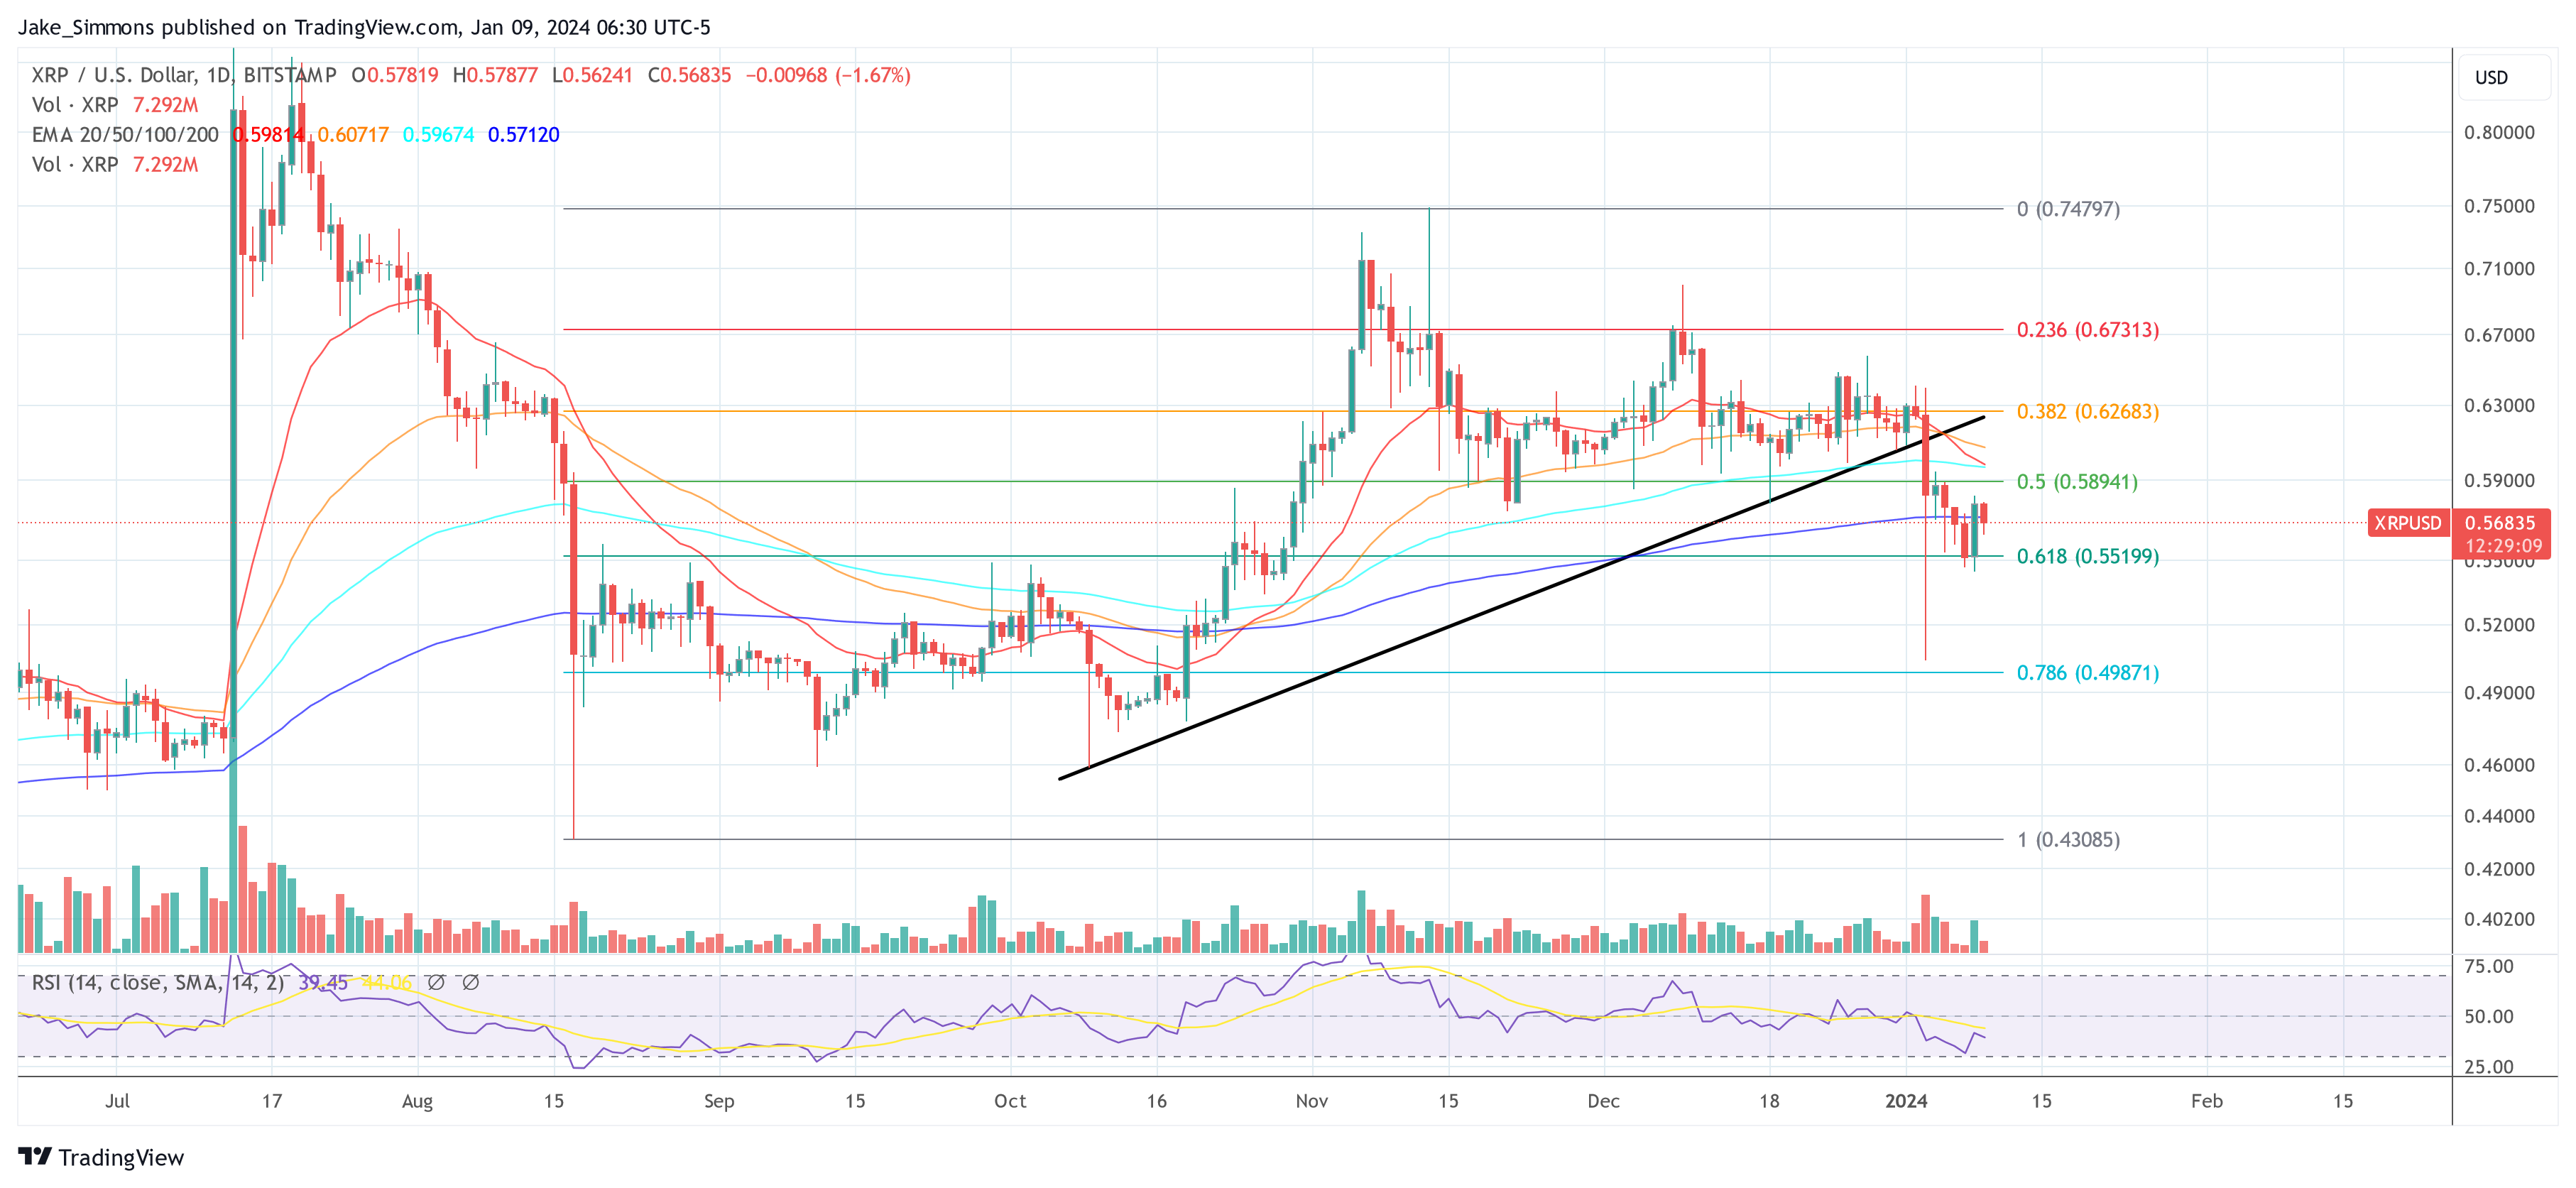
The XRP price has not fared well in recent months. Despite Ripple’s big win in the XRP lawsuit, the price has lost all its gains. At press time, XRP traded below the 200-day exponential moving average (EMA), which is considered to be the “bull line” in technical analysis.

Featured image from iStock, chart from TradingView.com
Disclaimer: The article is provided for educational purposes only. It does not represent the opinions of NewsBTC on whether to buy, sell or hold any investments and naturally investing carries risks. You are advised to conduct your own research before making any investment decisions. Use information provided on this website entirely at your own risk.


