On-Chain Data Paints Path To $2,400
Ethereum has cleared the $2,100 level during the past day, and if on-chain data is anything to go by, a rally to new yearly highs should be “easy.”
Ethereum Has No Major On-Chain Resistance At Higher Levels
An analyst in a post on X explained that Ethereum has overcome a major on-chain resistance zone with its recent price rally. The on-chain resistance and support levels are defined based on the density of investors who bought at them.
The reason behind this lies in how investor psychology tends to work. For any investor, their cost basis is an important level, so whenever the price retests, they pay special attention and might be tempted to make some kind of move.
A holder who had been at a loss before the retest might lean towards selling, as they may fear the cryptocurrency would dip below it again, so exiting at the break-even would at least mean they would avoid losses.
Similarly, an investor might decide to accumulate more if they had been in profits earlier, as they would see this same level as a profitable point of entry into the asset.
Now, here is a chart that shows how the Ethereum price ranges around the current price are looking in terms of the density of investors who share their cost basis there:
Looks like the levels above don't host the cost basis of that many investors | Source: @ali_charts on X
As displayed in the above graph, the Ethereum price range between $1,982 and $2,044 hosts the cost basis of about 1.67 million addresses, which acquired 38.73 million ETH at these levels.
Naturally, the more investors that share their cost basis inside a specific range, the stronger the reaction that the price would feel when it retests due to the aforementioned buying/selling effects.
Thus, this range that’s thick with investors would be a significant zone for the cryptocurrency. Since Ethereum has already surged past this area and has gained some distance over it with its latest break, the range is likely to play the role of support now.
Ethereum has this strong support area under its belt, while at the same time, there are no major resistance zones immediately above, as is apparent from the chart. This ideal setup means that, in theory, ETH shouldn’t have much trouble rallying towards the $2,426 level.
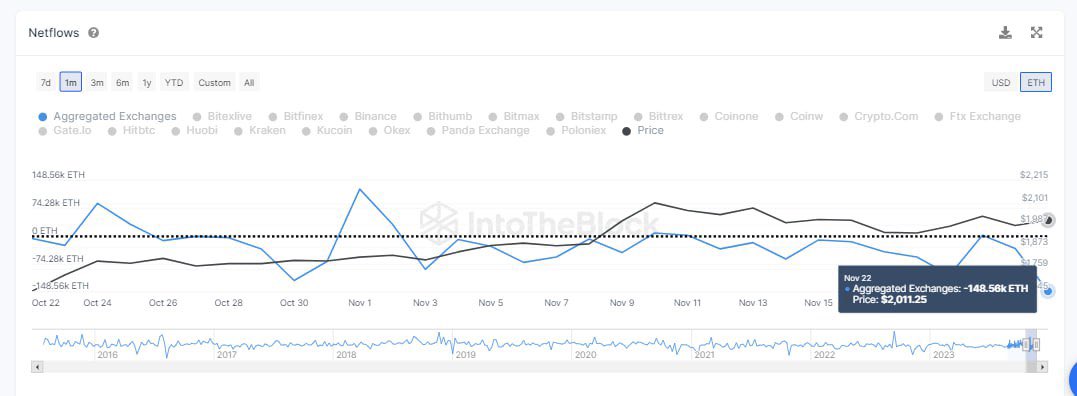
Another analyst has also pointed out how Ethereum has observed negative exchange netflows since the start of the month. The exchange netflow here is an indicator that keeps track of the net amount of ETH exiting or entering the wallets of all centralized exchanges.
The indicator's value has been negative recently | Source: @C__thumbs on X
The net outflows have amounted to over $1 billion during this period, a potential sign that significant buying has been occurring in the space. This certainly fuels the idea that ETH could explore new yearly highs shortly.
ETH Price
At the time of writing, Ethereum is trading at around $2,100, up 9% in the past week.
ETH has been climbing in the last few days | Source: ETHUSD on TradingView
Featured image from Bastian Riccardi on Unsplash.com, charts from TradingView.com, IntoTheBlock.com


