

Is Bitcoin Following Gold’s Power Curve? Analyst Predicts $450,000 Target By Q4 2025
While gold continues to set new all-time highs (ATH), trading at $3,420 per ounce, Bitcoin (BTC) may soon follow the precious metal’s price trajectory, according to crypto analyst Master of Crypto. The analyst pointed out that BTC has tracked gold’s ‘power curve’ since 2011.
Bitcoin To Mirror Gold Price Action?
In an X post published today, Master of Crypto highlighted how BTC has historically mirrored gold’s price momentum. However, this year presents a unique scenario – it’s the first time gold is hitting new ATHs during a Bitcoin bull cycle.
The analyst noted that if gold holds its current price levels and Bitcoin catches up, a $450,000 BTC by year-end is “still on the table.” To reach this target, BTC would need to rally by approximately 430%.

Supporting this view, fellow crypto analyst Daan Crypto Trades shared in a separate X post that the BTC-to-gold ratio is currently hovering around 25. He added:
This has been a level which has seen decent reactions in the past as it trades around between roughly 16-37 for most of the past 4 years. Gold is taking the spotlight here but we’ve historically seen that whenever gold goes, BTC is usually soon to follow.
If gold prices remain stable and the BTC-to-gold ratio climbs toward the upper end of its historical range – around 37 – Bitcoin could see substantial price appreciation relative to gold. Favorable macroeconomic trends may further accelerate BTC’s rise.
For example, the global M2 money supply recently reached a new ATH, while BTC remains about 22% below its own ATH of $108,786, recorded in January 2025. Historically, BTC tends to lag behind changes in M2 supply by 70 to 107 days, which suggests a potential new ATH by June or July 2025.

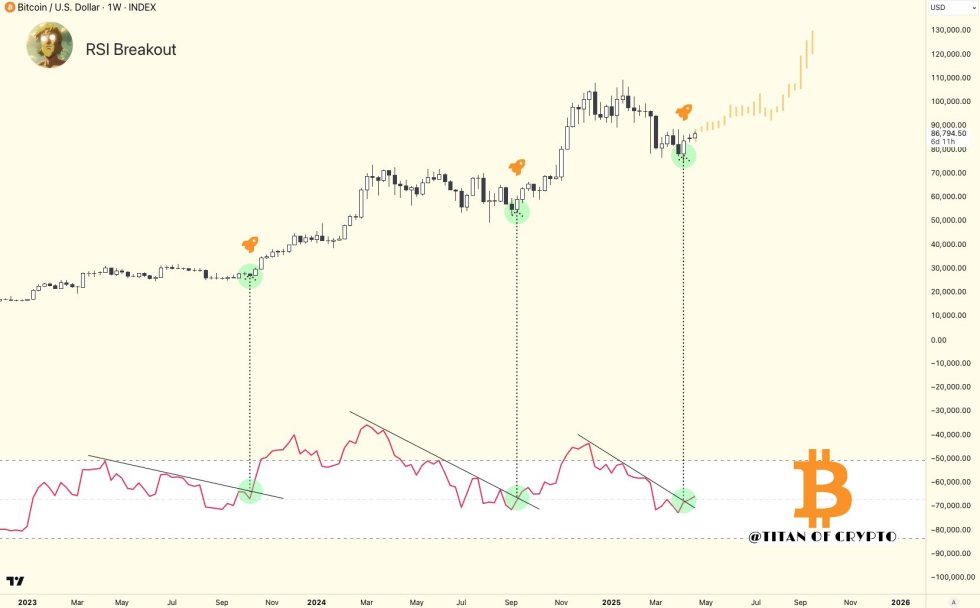
Meanwhile, momentum indicators such as the Relative Strength Index (RSI) are signalling renewed strength in BTC. In a recent X post, crypto analyst Titan of Crypto confirmed that BTC has completed a weekly RSI breakout, a development typically viewed as bullish.
Traders Foresee Further Downside For BTC
On the other hand, crypto analyst Ali Martinez offered a contrarian perspective, noting that nearly 60% of traders with open positions on Binance are currently betting on further downside for Bitcoin. The long/short ratio now sits at 0.67.

Despite the bearish sentiment, Bitcoin’s TD Sequential indicator recently flashed a buy signal on the weekly chart, suggesting a possible move toward $95,000 in the near term. At the time of writing, BTC is trading at $88,173, up 4.3% in the past 24 hours.

Featured Image from Unsplash.com, charts from X, and TradingView.com

Editorial Process for bitcoinist is centered on delivering thoroughly researched, accurate, and unbiased content. We uphold strict sourcing standards, and each page undergoes diligent review by our team of top technology experts and seasoned editors. This process ensures the integrity, relevance, and value of our content for our readers.


