Ethereum “Set For Further Gains,” Analyst Puts This Target
An analyst has explained that Ethereum could be set to see a further rally based on on-chain data. Here’s the level ETH may end up surpassing.
Ethereum Has No Significant On-Chain Resistance Ahead
In a new post on X, analyst Ali has discussed how Ethereum’s support and resistance levels are looking like based on on-chain data. In on-chain analysis, the potential for any level to provide any notable amount of support/resistance to the price depends on the number of investors who acquired their coins.
Here is a chart that shows the amount of ETH that was bought at some of the price ranges that the asset has visited before:
The density of cost basis at each of the different ETH price ranges | Source: @ali_charts on X
The graph shows that the $2,235 to $2,302 range carries the cost basis of a significant number of coins. More specifically, 1.84 million addresses acquired more than 6 million ETH inside this range.
Currently, the Ethereum price is trading just above this range, implying that all these investors are in the green. If the Ethereum spot price retraces into this range, these holders could show some reaction, as their profit-loss boundary would be retested.
Since these holders would have been in profits just before the retest, they might want to buy more, as they may believe that this same price range that was profitable earlier might turn out to be a worthy buy again.
Since the range is thick with investors, this buying effect that may arise on a retest could end up providing support to the price. If the support fails, the price might be between $1,958 and $2,029.
This range is much more robust, hosting a cost basis of over 37 million ETH. Ali notes that this support could potentially help cushion any corrections that may take place.
Now, Ethereum has strong support below, and as is apparent in the chart, there is no major demand wall above it simultaneously. Investors in loss (those with a cost basis higher than the current spot price) may be desperate to escape the market, so the price rising to their break-even can be an enticing exit opportunity.
If many holders are sitting at a loss, their demand zone could provide significant resistance to the price because of such selling. ETH has no such obstacles in the nearby price ranges so that the coin could rally further. “The path ahead of ETH is clear, with no significant supply barriers in sight, suggesting a potential rise to $2,700 or beyond,” explains the analyst.
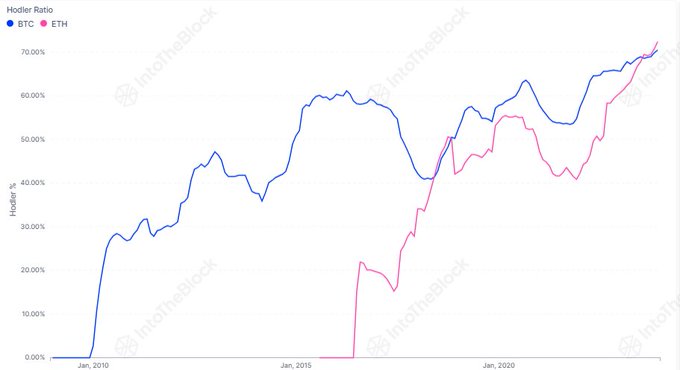
The market intelligence platform IntoTheBlock has also shared a chart that could provide further evidence for a bullish case of Ethereum.
The trend in the HODLer ratio for Bitcoin and Ethereum | Source: IntoTheBlock
As is visible in the above graph, the percentage of Ethereum investors who can be classified as “HODLers” (1 year+ holding time) has shot up recently. “This year, the percent of long-term ETH holders surpassed that of Bitcoin for the second time ever!” notes IntoTheBlock.
ETH Price
Ethereum is currently at the $2,316 mark, not too far above the support zone mentioned earlier.
Looks like the price of the coin hasn't been moving much recently | Source: ETHUSD on TradingView
Featured image from Kanchanara on Unsplash.com, charts from TradingView.com, IntoTheBlock.com
Disclaimer: The article is provided for educational purposes only. It does not represent the opinions of NewsBTC on whether to buy, sell or hold any investments and naturally investing carries risks. You are advised to conduct your own research before making any investment decisions. Use information provided on this website entirely at your own risk.


