

Ethereum Price Confirms Breakout From Ascending Triangle, Target Set At $7,800
Reason to trust
Strict editorial policy that focuses on accuracy, relevance, and impartiality
Created by industry experts and meticulously reviewed
The highest standards in reporting and publishing
Strict editorial policy that focuses on accuracy, relevance, and impartiality
Morbi pretium leo et nisl aliquam mollis. Quisque arcu lorem, ultricies quis pellentesque nec, ullamcorper eu odio.
Este artículo también está disponible en español.
The Ethereum price has finally broken out of a months-long consolidation pattern, signaling the possible start of a significant bullish move. The recent breakout of an Ascending Triangle formation suggests that ETH is set for more gains, with a crypto analyst suggesting a price target of $7,800 in the coming months.
Ethereum Price Targets $7,700 ATH
The Ethereum price is believed to be targeting a new all-time high of $7,800 after its recent breakout from an Ascending Triangle. For months now, the cryptocurrency has been trading within this classic bullish chart pattern, where prices make higher lows while facing strong resistance at a fixed level.
Related Reading
This consolidation pattern has been active since late 2024, establishing strong resistance at $4,000. TradingView analyst Sohaibfx has predicted that if Ethereum can surpass this resistance level, it would confirm a bullish trend, leading to a strong upward continuation in its price.
Looking at the analyst’s price chart, Ethereum spent several months navigating between $2,000 and $4,000 in Q1 2025. This region represented an accumulation phase where buyers had quietly built their positions in anticipation of a potential rally.
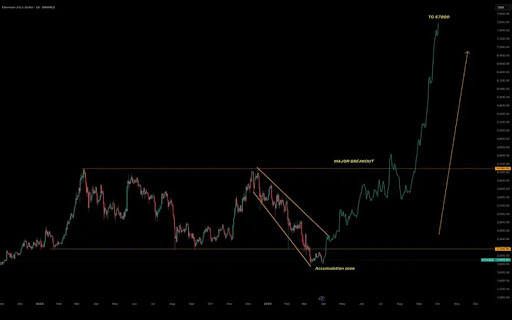
A descending channel marked in orange in the price chart also shows that Ethereum had experienced a significant pullback mid-to-late 2024 before breaking out. This was likely the final shakeout before it regained its bullish momentum.
According to Sohaibfx, a measured move of the Ascending Triangle suggests that Ethereum is poised for an explosive 333% surge to $7,800. This bullish target is calculated by determining the height of the triangle, which is the difference between its base at $2,000 and resistance level at $4,000.
When the price breaks above the resistance, the common method for estimating the possible next move is to add the triangle’s height to the breakout point, which gives a technical target of $6,000. However, based on past price behaviour and strong buying momentum, the Ethereum price could push even higher, with $7,800 being a key psychological level.
Support Levels And Momentum Indicators To Watch
In his price analysis, Sohaibfx has pinpointed the $4,000 and $3,000 price levels as support levels for Ethereum. This support should act as a safety net, where buyers are likely to step in to prevent further decline after Ethereum reaches its projected $7,800 target.
Related Reading
Moving forward, the analyst highlights key momentum indicators that should be monitored. While the analyst’s chart does not specify indicators like Moving Average Convergence Divergence (MACD) or Relative Strength Index (RSI), Ethereum’s sharp upward move suggests that strong momentum will be a major contributor to its rise to a new ATH.
Sohaibfx has advised traders to watch out for RSI levels above 70, as overbought conditions could signal a potential pullback while Ethereum approaches higher levels.
Featured image from Adobe Stock, chart from Tradingview.com


