
Ethereum Network Sees Nearly $1B in USDT Mints – Fresh Liquidity Amid Market Downturn
The Ethereum network witnessed another major stablecoin issuance, with $991.9 million in ETH-backed USDT minted just hours ago, according to onchain data shared by analyst Maartunn. This large-scale mint by Tether comes at a crucial time, as both Ethereum (ETH) and Bitcoin (BTC) face growing pressure across the market.
Ethereum has struggled to establish solid support over the past few days, trading near recent local lows as investor sentiment turns increasingly cautious. Meanwhile, Bitcoin continues to test range-bottom levels not seen since June, signaling that the broader crypto market remains in a corrective phase following last week’s violent liquidation event.
Large Tether mints, particularly those issued on Ethereum, are often viewed as signals of incoming liquidity — historically coinciding with short-term rebounds or preparations by market makers to “buy the dip.” However, given current volatility and declining momentum, traders remain divided over whether this mint represents a bullish setup or a liquidity safety measure during uncertainty.
Market Makers May Be Positioning for a Short-Term Bitcoin Bounce
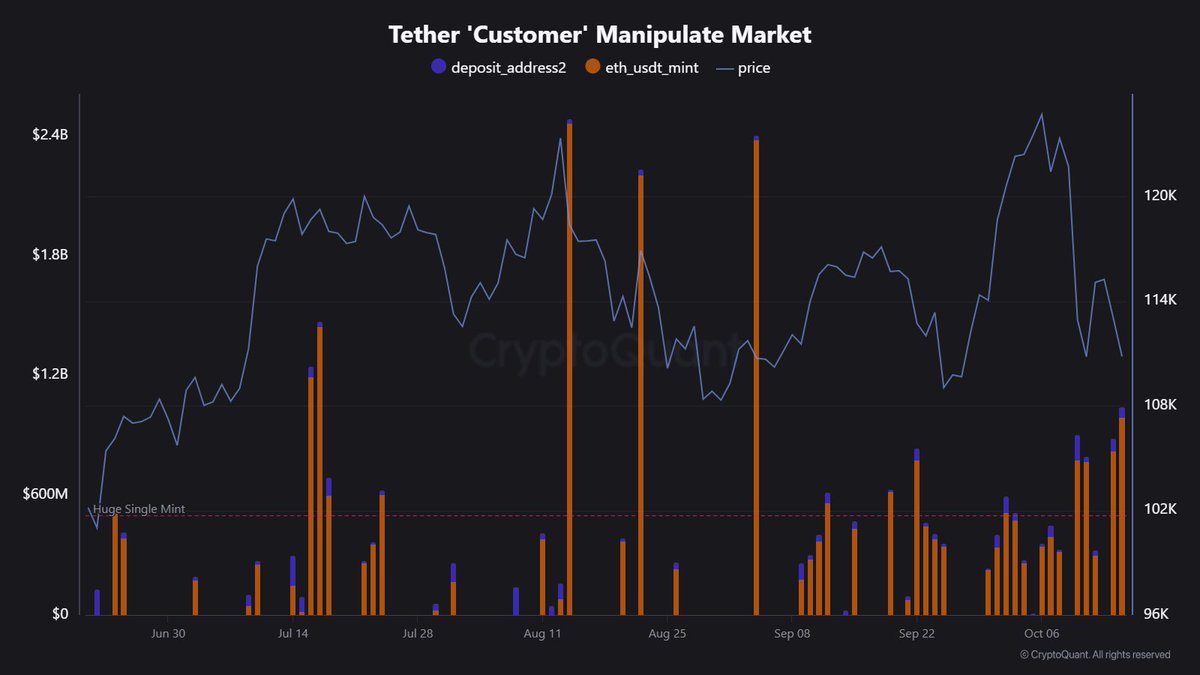
According to Maartunn, the recent ETH-backed Tether mint of nearly $1 billion could be an early sign that market makers are preparing to buy the dip. Historically, large USDT mints — especially those occurring during market downturns — have preceded short-term rebounds in Bitcoin (BTC) and other major assets. These mints often serve as liquidity injections, enabling trading desks and institutional players to deploy capital quickly once volatility begins to subside.
Maartunn shared a chart comparing BTC price movements with the timing of Ethereum-based USDT mints, showing a clear pattern: spikes in Tether issuance frequently align with local market bottoms. This correlation suggests that fresh stablecoin liquidity tends to flow into Bitcoin and Ethereum during periods of panic, stabilizing prices and occasionally triggering sharp relief rallies.
However, the market remains in a state of fear and uncertainty, with BTC trading near $110,000 and testing lower support levels. Funding rates remain subdued, and open interest continues to unwind after last week’s historic liquidation event.
In the coming days, price action around the $106K–$110K zone will be crucial to gauge sentiment. If the mint-driven liquidity begins to circulate into spot markets, Bitcoin could experience a short-term rebound. But if caution prevails and liquidity remains sidelined, the market could see another leg of consolidation before a clearer direction emerges.
Total Crypto Market Cap Tests Key Support
The total cryptocurrency market capitalization has fallen sharply, dropping over 4.4% in the last 24 hours to around $3.47 trillion, according to the chart. This decline extends the correction that began after the recent local peak near $4.2 trillion, erasing weeks of gains and pushing the market back toward its 200-day moving average — a critical long-term support now positioned near $3.46 trillion.
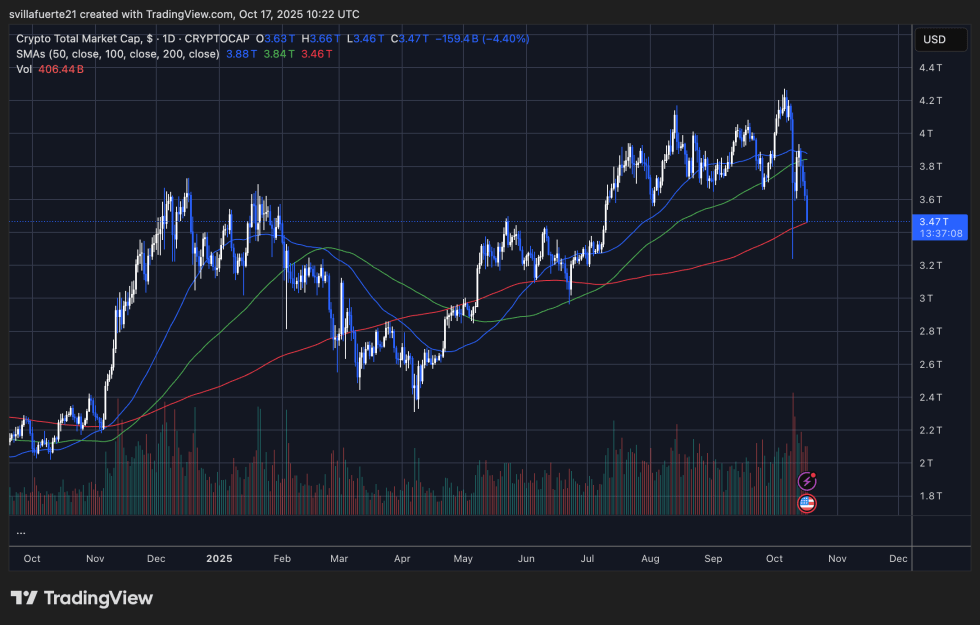
This level is significant because it represents both a psychological threshold and a technical pivot point for overall market structure. A clear break below it could open the door to deeper losses, with the next notable support seen near $3.2 trillion, while a strong rebound from here could confirm that the broader uptrend remains intact.
The 50-day and 100-day moving averages (currently at $3.88T and $3.84T) have both turned downward, reflecting weakening momentum and growing caution among investors. The recent spike in trading volume suggests capitulation-like activity, possibly linked to forced liquidations across Bitcoin, Ethereum, and major altcoins.
For now, the total market cap sits at a crossroads — maintaining the $3.4T zone could mark the start of stabilization, but losing it may confirm a deeper phase of correction before any sustainable recovery.
Featured image from ChatGPT, chart from TradingView.com

Editorial Process for bitcoinist is centered on delivering thoroughly researched, accurate, and unbiased content. We uphold strict sourcing standards, and each page undergoes diligent review by our team of top technology experts and seasoned editors. This process ensures the integrity, relevance, and value of our content for our readers.

