Can RNDR reach $25 in 2025?
With the 2025 bull run around the corner, the Render Network price can rise dramatically. The surge in demand for 3D graphics in entertainment raises the question: Could RENDER soar to $25 by 2025? Let’s explore the factors at play.
What is Render?
The Render Network is a decentralized platform for GPU rendering that allows artists to use powerful GPU nodes worldwide for their projects on demand. Node providers contribute their unused GPU power to a blockchain-based marketplace, which enables faster and cheaper rendering than traditional centralized services. In this system, the Render token serves as the medium of exchange between users and providers of GPU power.
Moreover, Render Network is part of the OTOY technology stack, which uses OctaneRender software. The integration extends to widely used applications such as Blender, Adobe After Effects, Houdini, Autodesk Maya, Unreal Engine, and more.
Market potential
The entertainment industry, particularly gaming and cinema, is the primary market for 3D graphics rendering. The demand for computer-generated imagery (CGI) and animation only continues to grow. For example, according to PwC Global, the entertainment sector can potentially exceed $3 trillion in value.
The growing demand for 3D graphics will favor platforms such as Render that offer scalable rendering services. Additionally, the Render Network’s availability on multiple blockchain networks – Ethereum, Polygon, and Solana – provides additional flexibility and reach. Among these, Solana stands out as particularly capable of handling increased rendering workloads due to its high scalability and cheap transaction fees.
Furthermore, Render has already collaborated with major productions, including the VR experience for “Batman: The Animated Series” and the opening titles for “Westworld.”
Market position
As of July 25, Render Network is number 2 in distributed computing, second only to Internet Computer, and ranks 32nd in the broader crypto market with a market cap of around $2.6 billion.
While some folks might be popping hopium pills and dreaming of tokens skyrocketing to $100 or even $1,000, the price analysis must be realistic. Render’s already high-ranking position limits its growth potential. It’s not really about crushing dreams but about looking at the market with clear eyes instead of rose-tinted glasses.
Inflation and supply
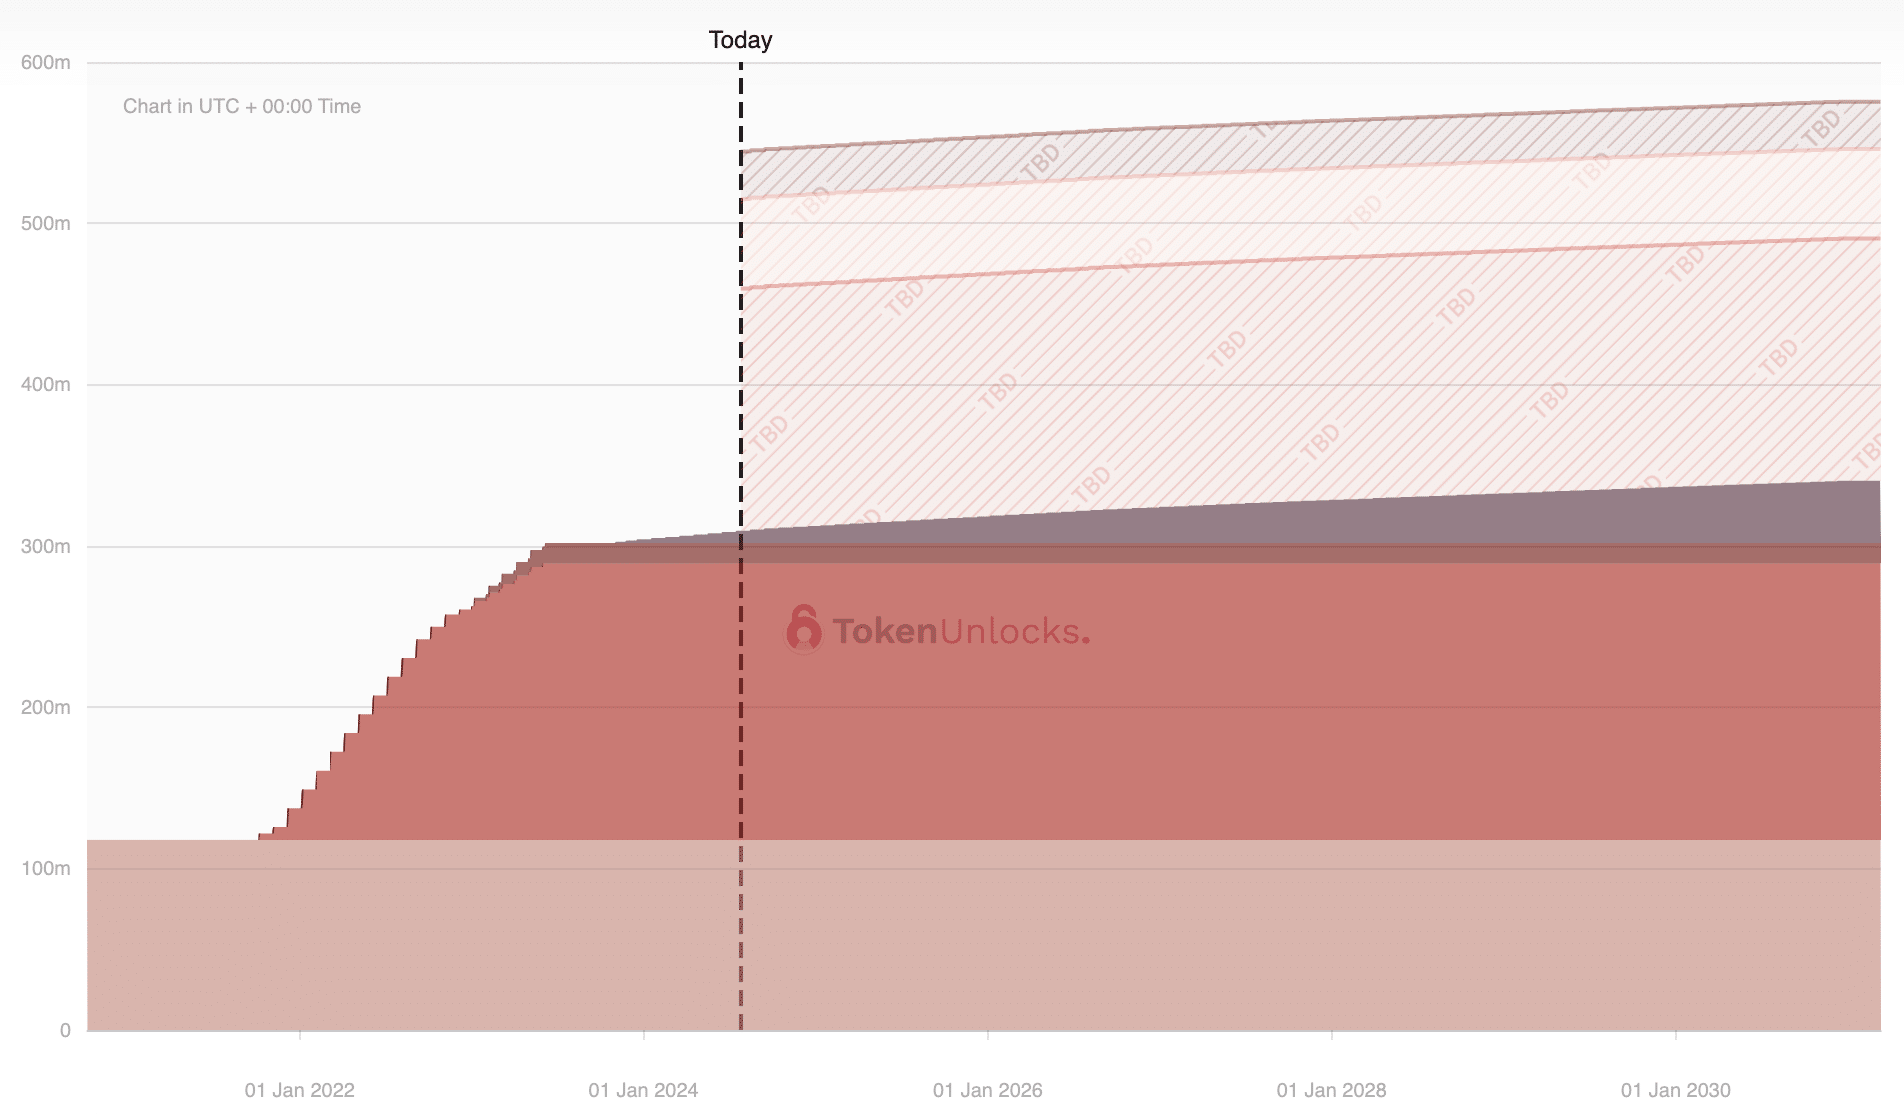
Render Network does not face significant concerns over token unlocks, as most tokens have already been unlocked. The only new tokens entering circulation are due to the inflation rate, set at 760,567 RENDER per month to incentivize users. However, the actual circulating supply has inflated differently. From January 2024 to July 2024, the supply increased by 18,950,928 RENDER, resulting in a 5.1% inflation rate over six months.

The Burn Mint Equilibrium deflationary mechanism has not prevented this level of inflation. If the trend continues, the annual inflation rate will reach 10.2%. This metric is crucial for forecasting the supply by mid-2025 to accurately assess the token’s valuation. Starting with a supply of 390,859,381 tokens, the projected supply would be approximately 430,727,038 RENDER.
Correlation with Bitcoin price movements
Analysis of the Pearson correlation coefficient between RENDER and BTC from 2020 to July 2024 shows a correlation of 0.727. The result indicates a strong linear relationship, with RENDER’s price movements closely following BTC’s.
The analysis also looked at the yearly standard deviations for RENDER and BTC, which were 1.725 and 0.616, respectively. Furthermore, RENDER had annual returns of 235.69%, while BTC had 62.98%. These numbers helped create a model to predict RENDER’s price changes based on BTC’s movements.
| RENDER | BTC | |
|---|---|---|
| Annual Return | 235.69% | 62.98% |
| Annual St. Deviation | 1.725 | 0.616 |
| Pearson Correlation Coefficient | 0.727 | 0.727 |
Render’s 2025 bull run price analysis
We developed a model with three scenarios: bear case, base case, and bull case. These scenarios correspond to BTC prices in 2025 of $100,000, $150,000, and $200,000, respectively. By standardizing the changes in BTC and RENDER, we calculated the expected price for RENDER in each scenario. The calculations assume a BTC price of $65,000 and a RENDER price of $6.80 as the starting points:
| Bear Case | Base Case | Bull Case | |
|---|---|---|---|
| BTC | $100,000 | $150,000 | $200,000 |
| RENDER | $14.26 | $24.91 | $35.57 |
The base case scenario appears to be the most realistic. Given the calculated supply, it projects RENDER reaching a market cap of approximately $10.73 billion and a price of $24.91. This market cap seems achievable, considering RENDER will not be the only token to rise during a bull run.
Disclosure: This article does not represent investment advice. The content and materials featured on this page are for educational purposes only.


