
Bitcoin Open Interest Across All Exchanges Approaching All-Time High: $74,000 Incoming?
Bitcoin is trading at September highs, retracing after breaking above $66,000 on October 14. Although the coin is trading lower at spot rates, the path of least resistance appears northwards, and the trend is shifting, aligning with gains of Q1 2024.
Bitcoin Open Interest Rising, Approaching $40 Billion
After months of lower lows, the world’s most valuable coin is lifting off, and with it, sentiment is improving. The latest market data shows that the Bitcoin open interest across all major derivatives exchanges is approaching all-time high.
According to Coinglass, open interest rose to over $39 billion in March 2024. As of October 15, the Bitcoin open interest is over $37.6 billion, expanding from yesterday’s $34.6 billion.
Open interest is usually used to gauge trader interest. The exchange data combines the number of all leveraged short and long positions posted by traders across top exchanges, including Binance and Bybit.
Since open interest is not directional and doesn’t indicate whether there are more buyers or sellers at any point, the metric gauges trader interest and willingness to engage.
Whenever crypto prices rise, as was the case from early Q4 2023, open interest began swelling before peaking at an all-time high of over $39 billion in March 2024.
Falling Bitcoin prices from Q2 2024 also coincided with a contraction in open interest. By August 6, when BTC fell below $50,000, the Bitcoin open interest crashed below $26 billion before steadily recovering.
Will BTC Prices Rally Above $74,000?
Considering the growth rate over the past 24 hours, it is highly likely that any break and close above $66,000 could attract more traders to open leverage positions. In that event, the Bitcoin open interest would swell to above $40 billion, printing an all-time high.
From the daily chart, Bitcoin has strongly rejected $66,000, marking September highs. However, if bulls of October 14 flow back, prices might float higher, back to July 2024 highs of $70,000. For now, traders are confident that prices will align with September gains and rally to March peaks.
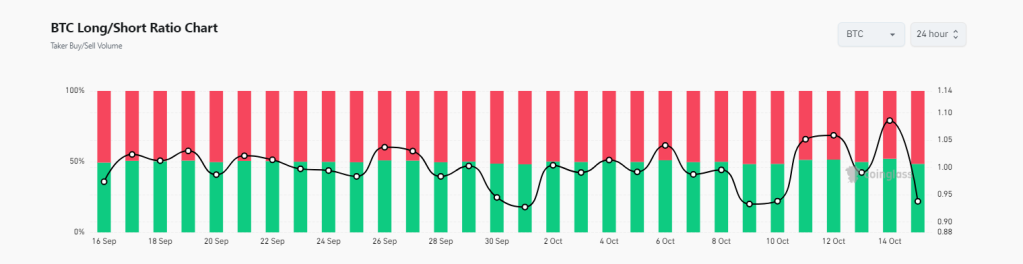
While confidence is high, the long-short ratio data from Coinglass reveals fewer long than short volumes. Currently, 51% of BTC trading volume is sell, while 49% is buy volume. This data signals that most traders are still bearish.
Feature image from Canva, chart from TradingView

