
Bitcoin Coinbase Premium Green For 73 Days, Longest Streak Since ETF Launch
The Bitcoin Coinbase Premium Gap has been positive for a while now, a potential indication of buying interest from US-based investors.
30-Hour MA Of Bitcoin Coinbase Premium Gap Continues To Be Green
In a new post on X, CryptoQuant community analyst Maartunn has talked about the latest trend in the Coinbase Premium Gap of Bitcoin. The “Coinbase Premium Gap” here refers to an indicator that keeps track of the difference between the BTC price listed on Coinbase (USD pair) and Binance (USDT pair).
The metric basically tells us about how the buying or selling behaviors differ between the userbases of the two platforms. The former is the main destination of the US-based investors, especially the large institutional entities, while the latter has a more global traffic.
When the indicator’s value is positive, it means the American whales are applying a higher buying pressure (or lower selling pressure) than the Binance users. On the other hand, it being negative suggests a net higher selling pressure on Coinbase has pushed BTC to a lower rate on there.
Now, here is a chart that shows the trend in the 30-hour moving average (MA) of the Bitcoin Coinbase Premium Gap over the past year and a half:
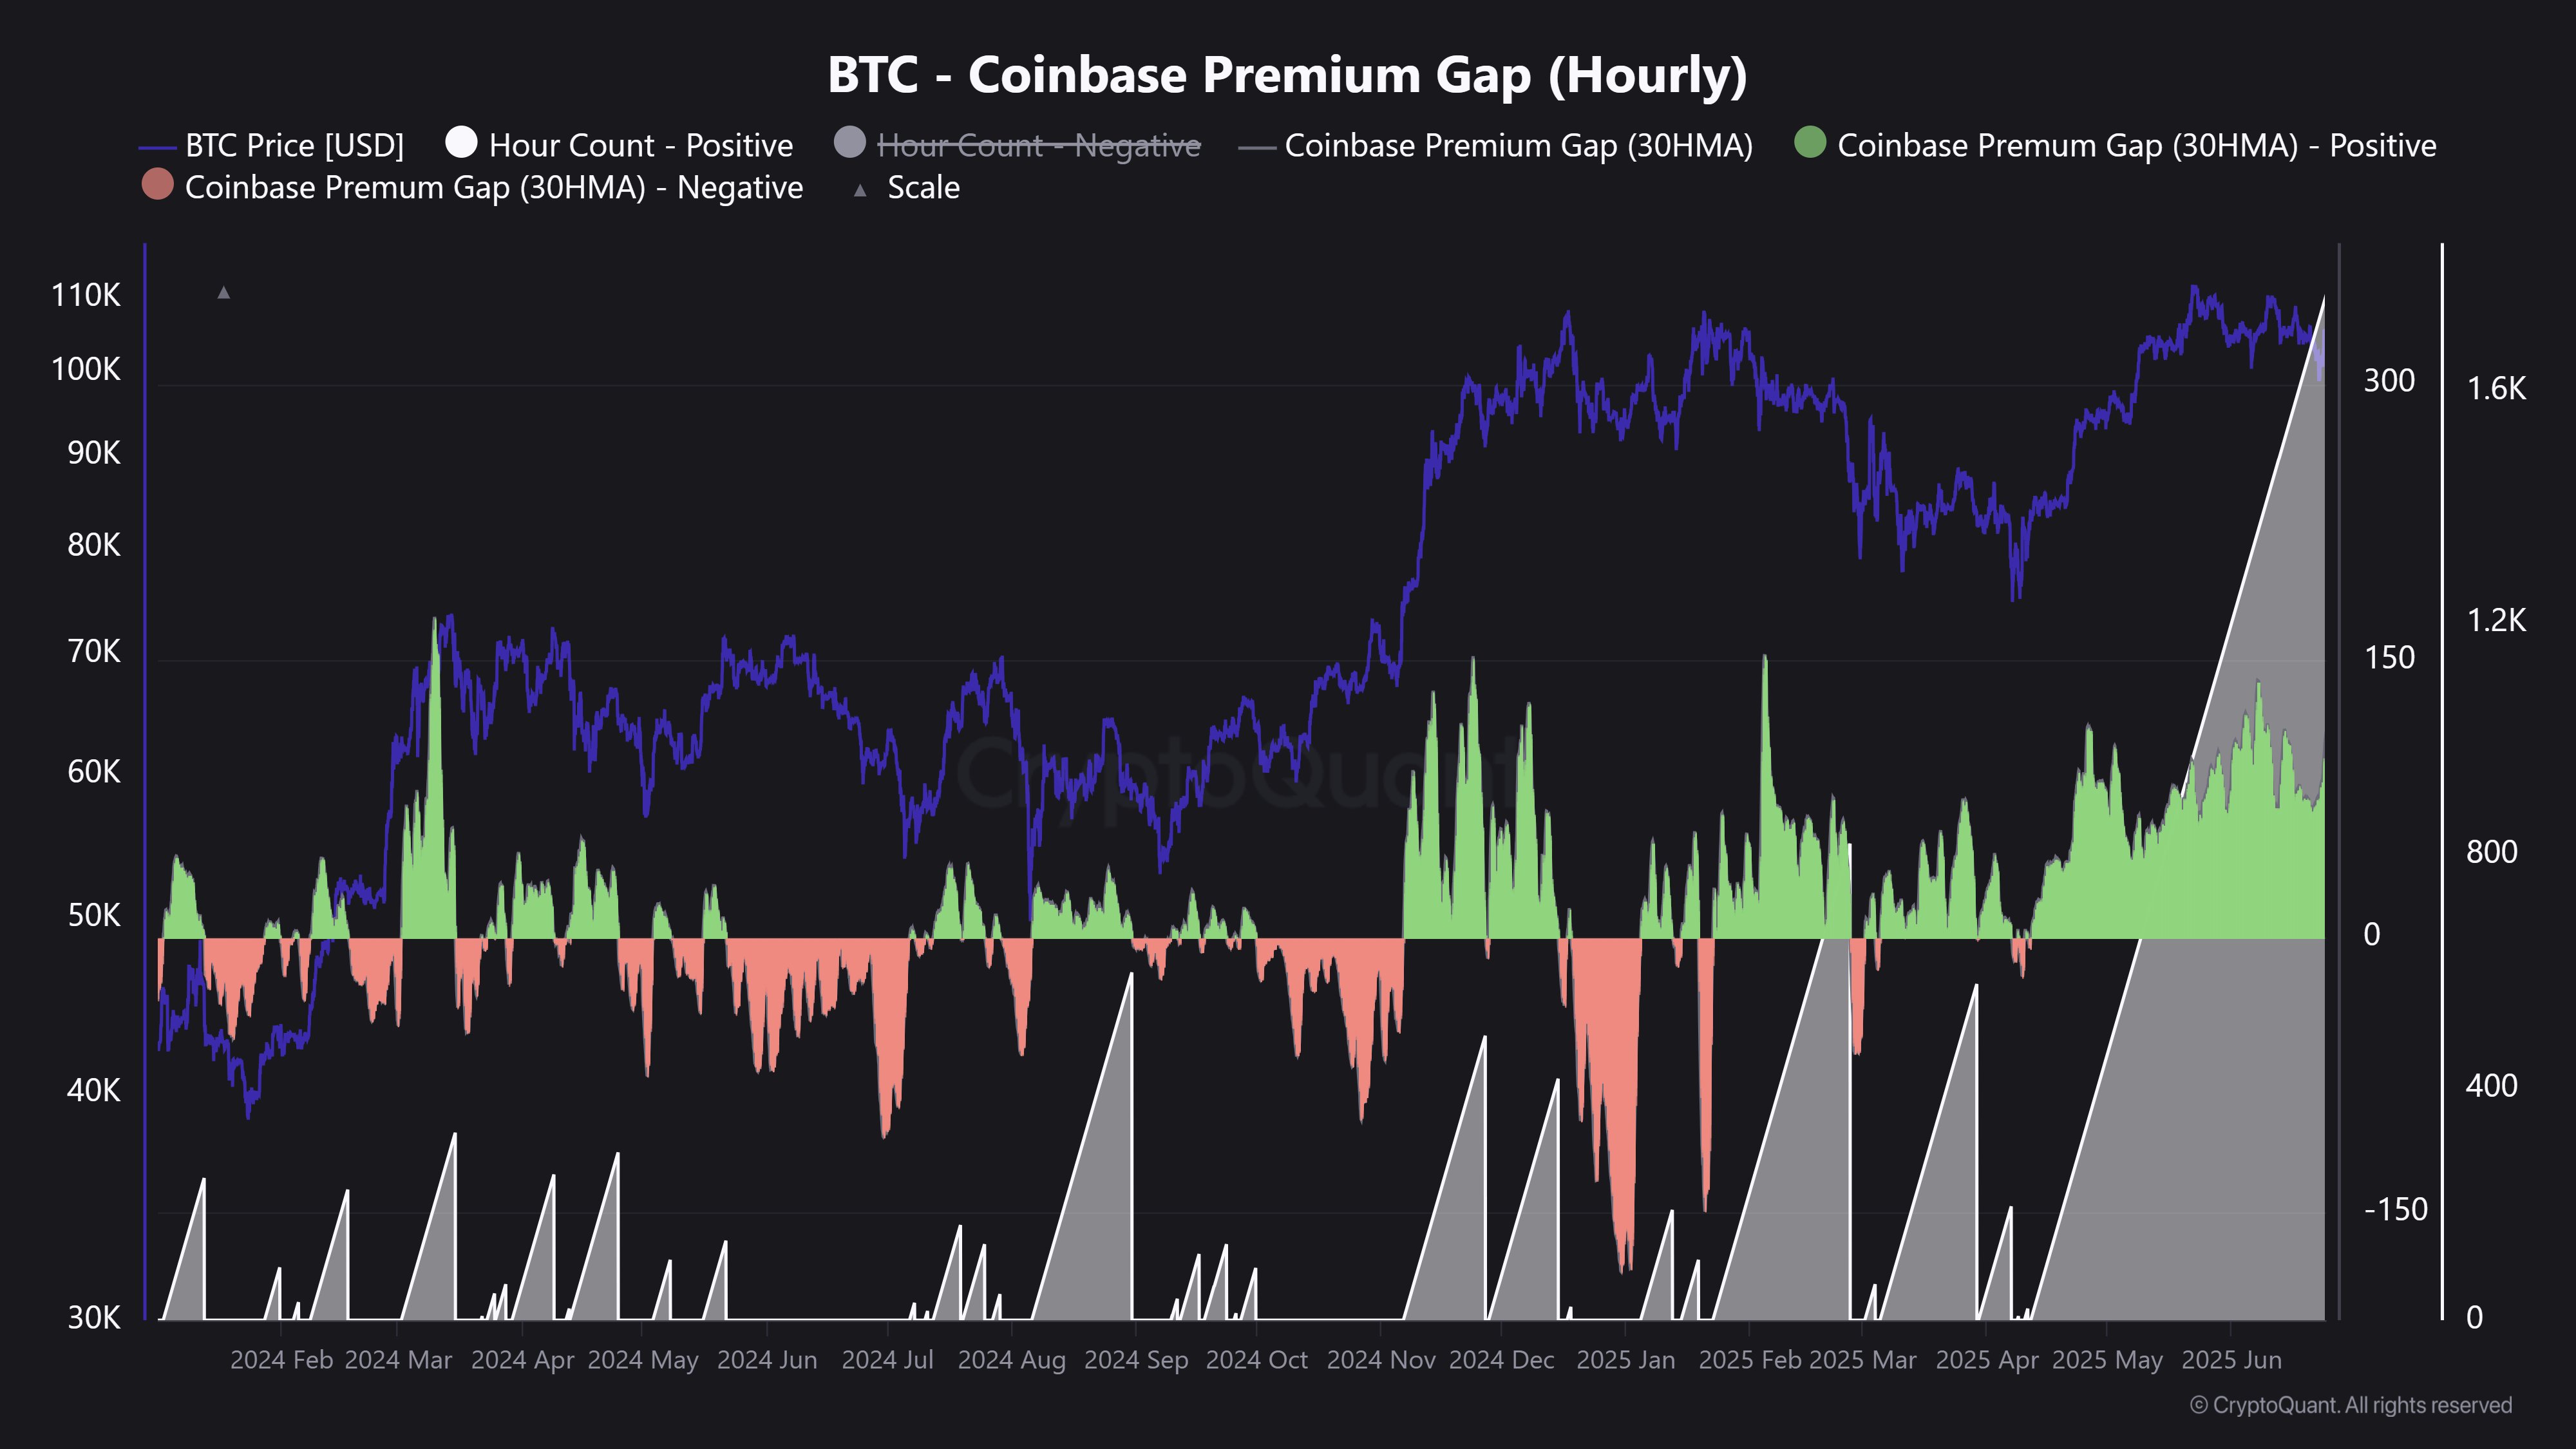
Looks like the value of the metric has been positive in recent weeks | Source: @JA_Maartun on X
As displayed in the above graph, the 30-hour MA Bitcoin Coinbase Premium Gap has been above the zero mark for a while now, suggesting buying pressure has consistently been higher on Coinbase than Binance.
So far, the green streak in the metric has maintained for around 73 days, which is quite long. In fact, this is the longest period of buying on Coinbase since the spot exchange-traded fund (ETF) launch at the start of last year.
In the period between then and now, Bitcoin has often shown correlation with the Coinbase Premium Gap, potentially implying that US-based institutional investors have had a significant presence in the sector.
Considering this trend, the recent green streak in the metric can naturally be a positive sign for the asset. That said, things can quickly change in the cryptocurrency market sometimes, so the indicator could be to keep an eye on to watch out for any reversals into the negative zone.
In some other news, Bitcoin’s latest rebound has meant that it has managed to stay above a key support zone, as the on-chain analytics firm Glassnode has pointed out in an X post.
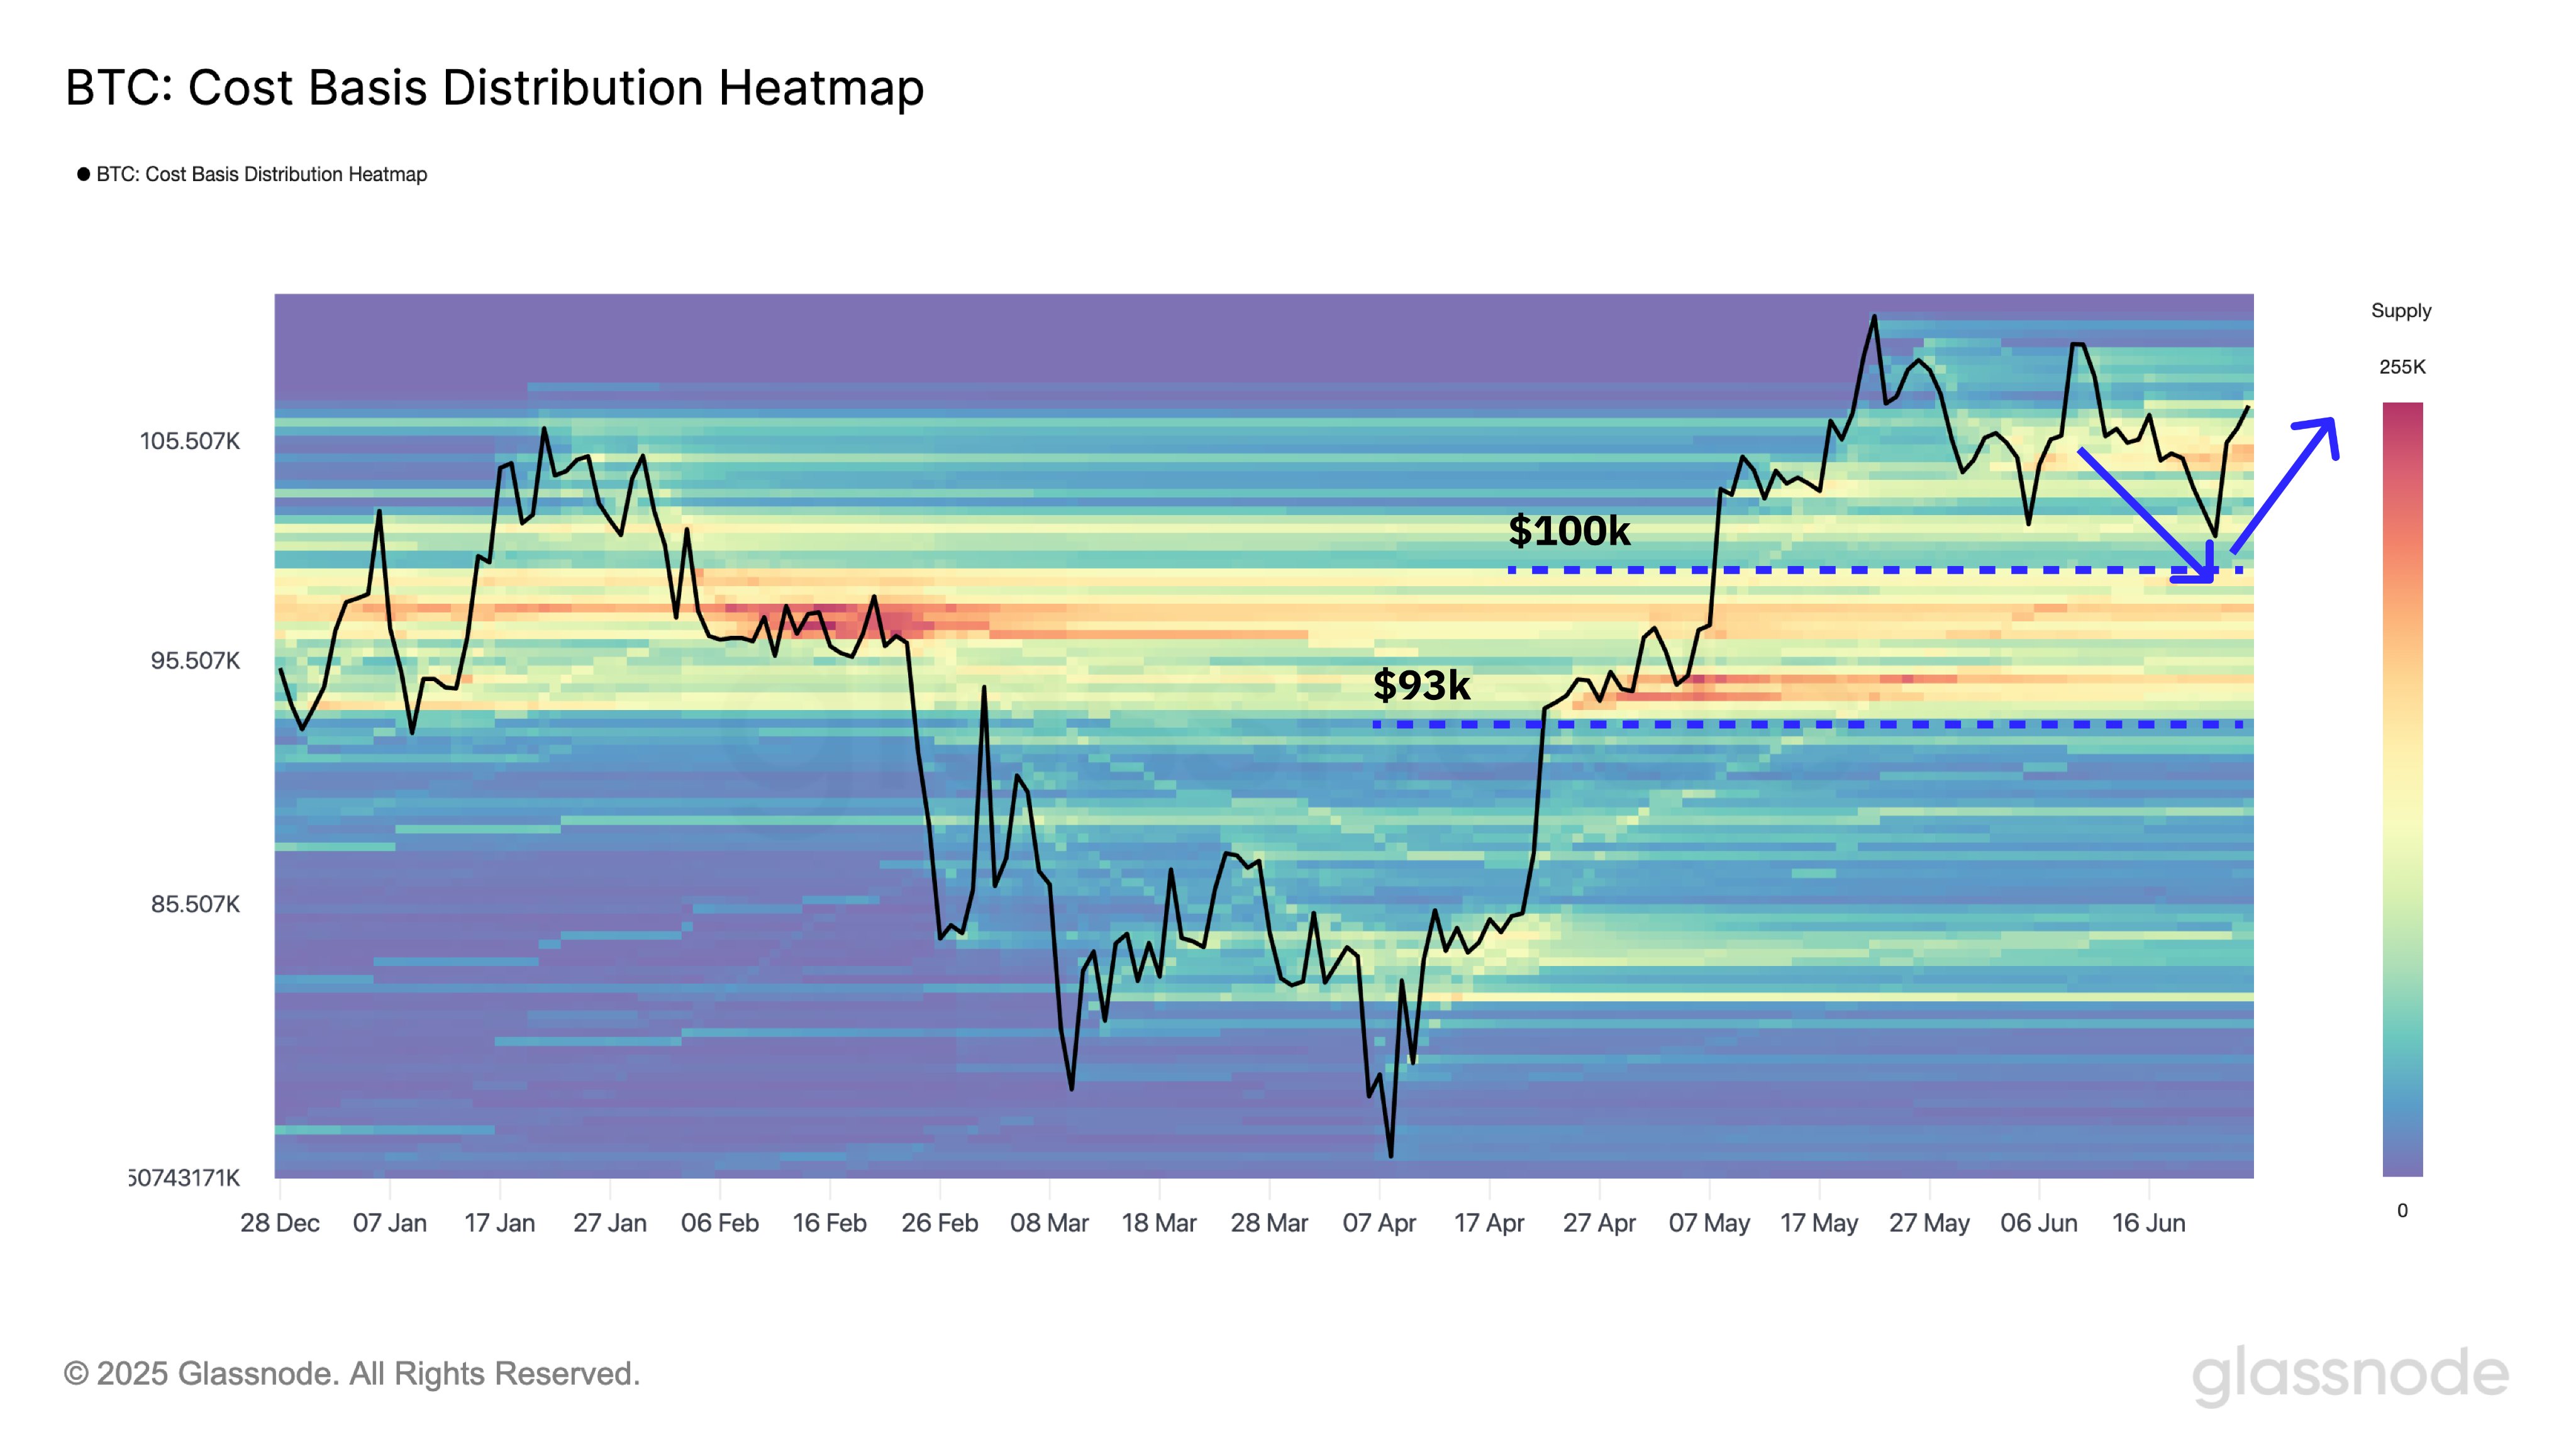
The trend in the Cost Basis Distribution of BTC | Source: Glassnode on X
The chart shows the data for the Cost Basis Distribution of Bitcoin. According to this indicator, a notable amount of the asset’s supply was last purchased between $93,000 and $100,000. “Price holding above this band suggests the broader bullish structure is intact despite short-term volatility,” notes Glassnode.
BTC Price
At the time of writing, Bitcoin is trading around $107,800, up over 2% in the last week.
The price of the coin has been making recovery | Source: BTCUSDT on TradingView
Featured image from Dall-E, Glassnode.com, CryptoQuant.com, chart from TradingView.com

Editorial Process for bitcoinist is centered on delivering thoroughly researched, accurate, and unbiased content. We uphold strict sourcing standards, and each page undergoes diligent review by our team of top technology experts and seasoned editors. This process ensures the integrity, relevance, and value of our content for our readers.


