Analyst’s ABC Correction Forecast Plays Out Perfectly, Second Half Predicts Bullish Impulse To $2.8
Este artículo también está disponible en español.
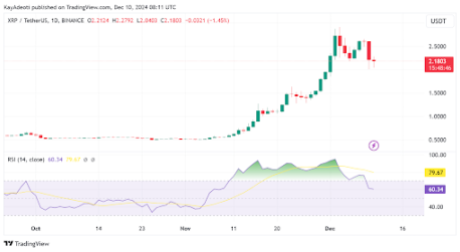
The XRP price action has played out notable volatility in the past eight or so weeks, with intense trading activity not seen in over six years. Following the U.S. presidential election on November 5, 2024, where Donald Trump secured victory, XRP’s value surged over 400%, reaching a peak of $2.90 on crypto exchange Binance on December 3.
However, the XRP price has experienced a downturn in the past week. Interestingly, this XRP price correction seems to be playing out an ABC correction path, with technical analysis suggesting a more downturn before the next leg up.
XRP Price Exhibiting ABC Correction
The XRP price correction since reaching the $2.9 mark has been highlighted by an ABC pattern that is almost nearing its end. Particularly, this pattern constitutes two downtrend waves A and C and a minor uptrend wave B in between.
Related Reading
According to the price chart below, which is of the XRP/US Dollar pair on the 4-hour candlestick timeframe, the first downtred wave A kicked off after the XRP price was rejected at resistance around $2.9 on December 3 up until it bottomed out around $2.16 on December 5, representing a 25% decline in two days. From there, it went on a minor uptrend wave B, which indicated that the bulls were still in action. Wave B culminated with a lower high at $2.65 on December 9, which translates to another 22% increase in four days.
Since reaching this lower high, the XRP price has kicked off another correction path in the past 24 hours, giving rise to the notion of corrective wave C now in action. If a similar trend were to play out like that of wave A, we could see the XRP price correcting by another 25% from $2.65, which would put the bottom just below $2 before another bounce up. This is very logical, considering that the $2 price level serves as a psychological threshold that the bulls would be preventing a break below.
Bullish Impulse Suggests Next Move To $2.8 And Beyond
At the time of writing, the XRP price is trading at $2.19 and is down by almost 10% in the past 24 hours. The ongoing wave C, which is the final leg of the ABC corrective pattern, could continue on a downtrend until it reaches resistance at $2. Technical indicators support this outlook, especially the Relative Strength Index (RSI).
Related Reading
The RSI has slipped below its overbought zone for the first time since November 10. This signals a cooling off of the bullish momentum that propelled XRP to its recent highs, paving the way for the corrective wave C to run its course.

Despite this pullback, market dynamics suggest that a bounce from the $2 level is a strong possibility. Such a rebound could mark the beginning of a renewed bullish wave and drive the XRP price toward $2.80 and beyond. This scenario aligns with the broader outlook for XRP, which is still rolling in investor optimism regarding regulatory clarity after a new US presidential administration comes into power in January 2025.
Featured image created with Dall.E, chart from Tradingview.com


