Aave May Rally 20% Supported by Historical Levels, But Crucial Resistance Remains
Aave’s price surged to $88 just two weeks ago, but currently, the altcoin is experiencing a correction. Over the past 24 hours, Aave has dropped over 4%, and on the weekly chart, it has depreciated more than 7%. The technical outlook for Aave appears bearish, with both demand and accumulation declining on the one-day chart.
Presently, Aave is hovering near a critical support level, and upcoming trading sessions will be decisive in determining the coin’s direction. Although the price is currently above the crucial support zone, it faces two important resistance levels that it must overcome.
Failure to surpass the immediate resistance could lead to a resurgence of bearish sentiment, potentially pushing the price below the local support level. Additionally, Aave’s market capitalization has declined, indicating a gradual loss of buyer momentum on the daily chart.
Aave Price Analysis: One-Day Chart
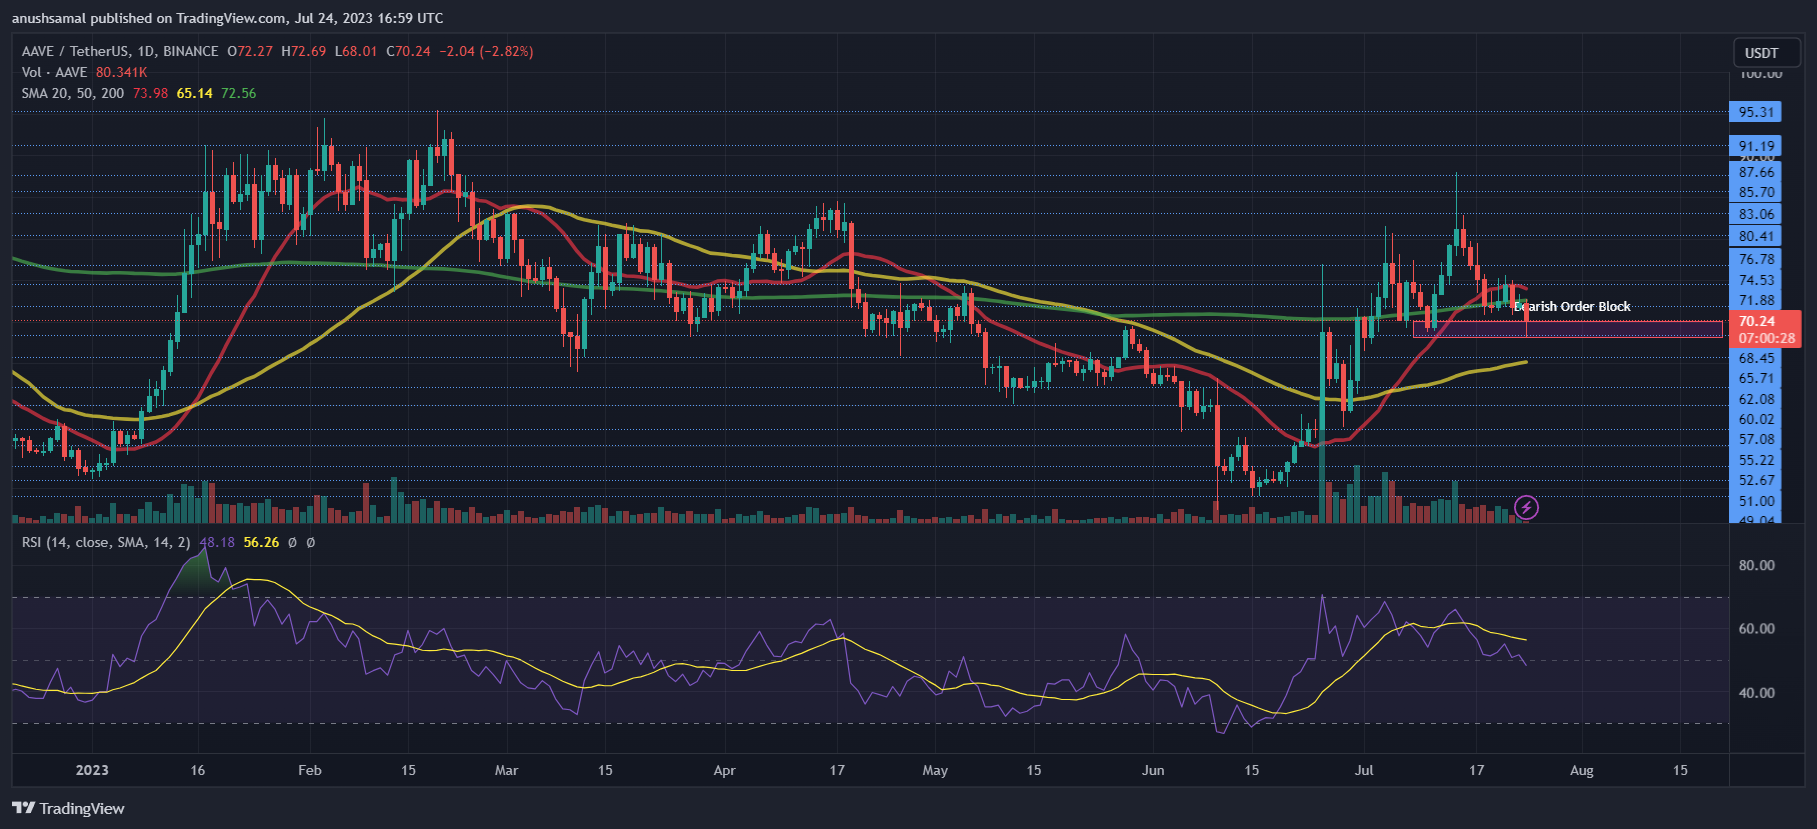
As of press time, the altcoin’s value stands at $70, following a correction from its previous $88 peak. The coin encounters resistance levels at $72 and $75.
It is important to note that if the price drops from its current level, sellers could become active. This is due to the presence of a bearish order block, signifying high sell volume.
Failing to maintain a price above $68 may result in Aave trading near $66 and $64. However, historically, the $68 price mark has proven to be a crucial rallying point, as evidenced by the previous rally to $88, which was initiated from the same level.
However, if the coin can maintain its price above the $68 level in the upcoming trading sessions, it may have the potential for a 27% rally opportunity.
Technical Outlook

Following the rejection at the $75 level, Aave’s buyers have been encountering difficulties in the market. The Relative Strength Index (RSI) also signalled this weakening buying strength as it dipped below the half-line.
Additionally, the price fell below the 20-Simple Moving Average line, indicating a shift away from buyer-driven momentum. To revive buyer interest, Aave would need to break above the $72 mark, potentially drawing them back into the market.

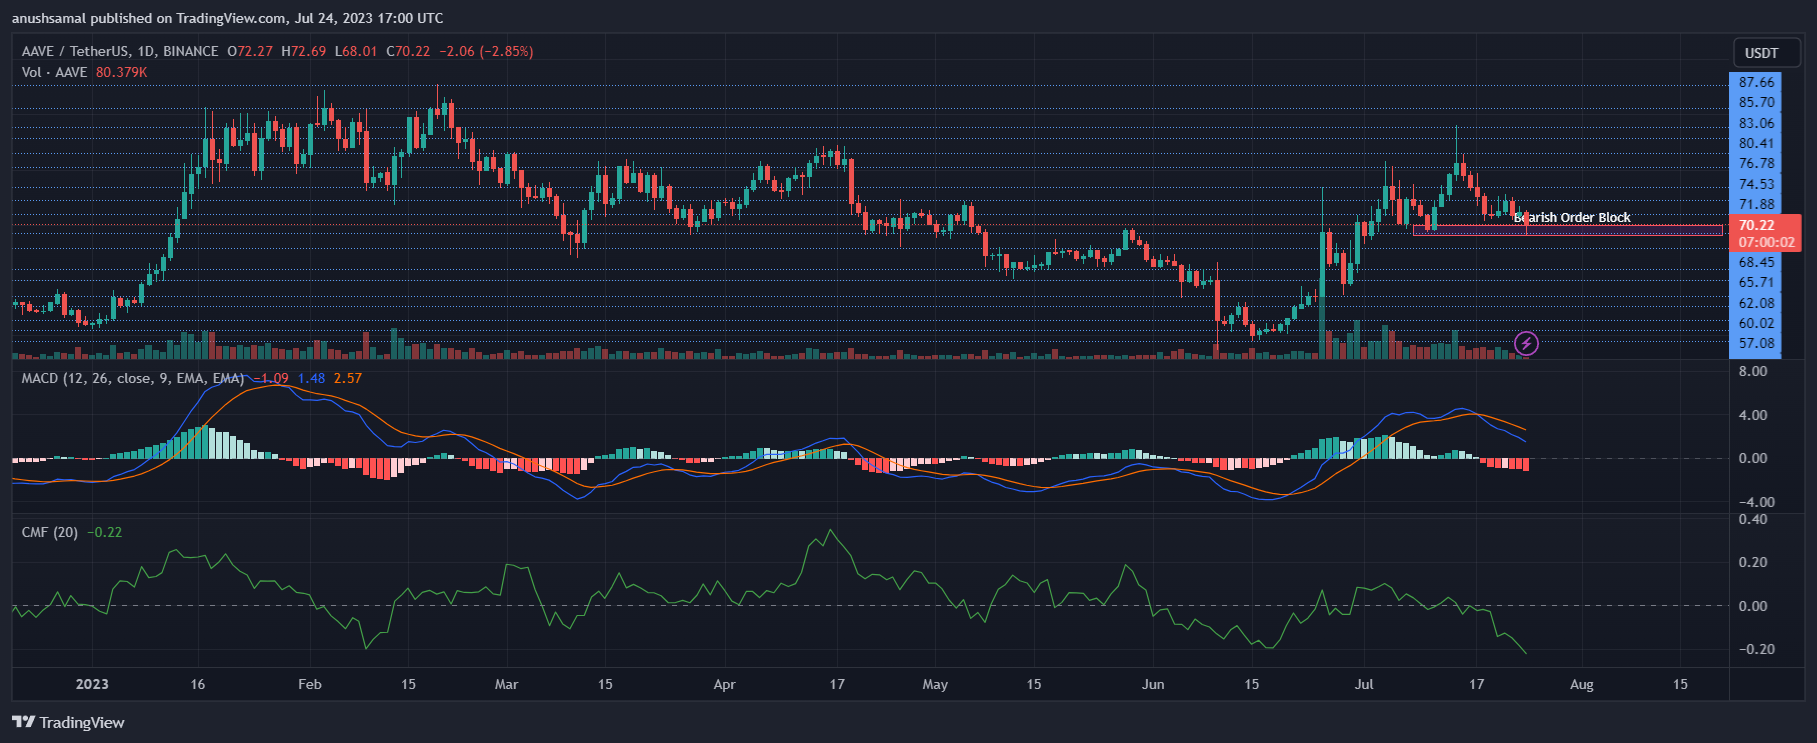
The altcoin showed sell signals in line with declining demand. The Moving Average Convergence Divergence (MACD) was negative, displaying red histograms, which are associated with sell signals on the chart.
Additionally, the Chaikin Money Flow (CMF), an indicator of capital inflows and outflows, was below the half-line, indicating that at the time of writing, capital outflows exceeded inflows. These technical indicators suggest a bearish sentiment in the market and potentially lower demand for the altcoin.
Featured image from UnSplash, chart from TradingView.com


